prometheus
介绍
Prometheus是一个开源系统 监控和警报工具包最初由SoundCloud 构建。自 2012 年成立以来,许多 公司和组织已经采用了 Prometheus,并且该项目具有非常 活跃的开发人员和用户社区。它现在是一个独立的开源项目 并独立于任何公司进行维护。为了强调这一点,并澄清 该项目的治理结构,Prometheus 于 2016 年加入云原生计算基金会作为Kubernetes 之后的第二个托管项目。
官网
下载(建议用docker)
Download | Prometheus - Prometheus 监控系统
Download Grafana | Grafana Labs
docker部署prometheus和Grafana
接入案例
All in one
docker部署这些监控prometheus、grafana、node-exporter、redis-exporter、elasticsearch-exporter、opengauss-exporter、nginx-exporter、cAdvisor
注意事项
- minio的监控不需要用docker部署监控,minio自己就有监控导出功能,需要在接入minio中找到mc生成token的方法,然后将token和path填入prometheus.xml中
- jmx的监控需要使用javaagent的方式接入接入springboot
- nginx的监控需要对本机放行监控接口
- 配置OpenGauss数据库连接时,需要创建监控用户
- cadvisor可选镜像版本查看
- minio-cluster的配置需要用mc生成
- 后端启动时需要以javaagent的方式启动jmx服务
# =====================================================
# 监控系统 Docker Compose 配置文件
#
# 配置说明:
# - name: 项目名称,用于标识整个监控系统
# - services: 定义所有监控相关的服务
# - networks: 使用外部已存在的网络 bzl
#
# 资源限制说明:
# - Prometheus: 2G内存/1CPU - 用于时序数据存储和查询
# - Grafana: 1G内存/0.5CPU - 用于数据可视化
# - Exporters: 256M内存/0.2CPU - 用于数据采集
# - cAdvisor: 512M内存/0.5CPU - 用于容器监控
#
# 日志配置说明:
# - 主要服务(Prometheus/Grafana): 100M/3个文件
# - 其他服务: 50M/3个文件
# - 使用 json-file 驱动以支持日志轮转
# =====================================================

name: monitoring-system

services:
  # ----------------------------------------
  # Prometheus:时序数据库
  #
  # 功能:
  # - 存储和查询监控指标数据
  # - 支持强大的查询语言PromQL
  # - 提供数据存储和告警功能
  #
  # 配置说明:
  # - 数据持久化:使用本地存储
  # - 热重载:支持配置热重载
  # - 安全性:使用nobody用户运行
  # - 资源限制:2G内存/1CPU
  # ----------------------------------------
  prometheus:
    image: prom/prometheus
    container_name: prometheus
    env_file: .env
    ports:
      - "${PROMETHEUS_PORT}:9090"  # Web界面端口映射
    volumes:
      - ./prometheus.yml:/etc/prometheus/prometheus.yml  # 主配置文件
      - ${PROMETHEUS_DATA_DIR}:/prometheus/data         # 数据持久化目录
    command:
      - "--config.file=/etc/prometheus/prometheus.yml"  # 指定配置文件路径
      - "--web.enable-lifecycle"                        # 启用热重载功能
      - "--storage.tsdb.retention.time=${PROMETHEUS_RETENTION_TIME}"  # 数据保留时间
      - "--storage.tsdb.path=/prometheus/data"                        # 数据存储路径
      - "--storage.tsdb.retention.size=${PROMETHEUS_RETENTION_SIZE}"  # 数据存储大小限制
    user: "65534:65534"  # 使用nobody用户运行,提高安全性
    deploy:
      resources:
        limits:
          memory: ${PROMETHEUS_MEMORY_LIMIT}
          cpus: '${PROMETHEUS_CPU_LIMIT}'
        reservations:
          memory: ${PROMETHEUS_MEMORY_RESERVATION}
          cpus: '${PROMETHEUS_CPU_RESERVATION}'
    healthcheck:
      test: [ "CMD", "wget", "-q", "--spider", "http://localhost:9090/-/healthy" ]
      interval: ${HEALTHCHECK_INTERVAL}
      timeout: ${HEALTHCHECK_TIMEOUT}
      retries: ${HEALTHCHECK_RETRIES}
    restart: unless-stopped
    logging:
      driver: "json-file"
      options:
        max-size: "${MAIN_SERVICE_LOG_MAX_SIZE}"
        max-file: "${MAIN_SERVICE_LOG_MAX_FILE}"
    extra_hosts:
      - "host.docker.internal:host-gateway" # 允许容器访问宿主机
    networks:
      - bzl

  # ----------------------------------------
  # Grafana:可视化平台
  #
  # 功能:
  # - 展示监控数据的Web界面
  # - 支持多种数据源和丰富的图表类型
  # - 提供告警和通知功能
  #
  # 配置说明:
  # - 安全性:禁用匿名访问和用户注册
  # - 本地化:默认中文界面
  # - 时区:使用浏览器时区
  # - 资源限制:1G内存/0.5CPU
  # ----------------------------------------
  grafana:
    image: grafana/grafana
    container_name: grafana
    env_file: .env
    ports:
      - "${GRAFANA_PORT}:3000"  # Web界面端口映射
    volumes:
      - ${GRAFANA_DATA_DIR}:/var/lib/grafana           # 数据持久化目录
      - ${GRAFANA_PROVISIONING_DIR}:/etc/grafana/provisioning  # 配置目录
    user: "472:472"  # 使用grafana用户运行
    environment:
      - GF_SECURITY_ADMIN_USER=${GRAFANA_ADMIN_USER}      # 管理员用户名
      - GF_SECURITY_ADMIN_PASSWORD=${GRAFANA_ADMIN_PASSWORD}  # 管理员密码
      - GF_DEFAULT_LANGUAGE=zh-CN                         # 设置中文界面
      - GF_DATE_FORMATS_DEFAULT_TIMEZONE=browser          # 使用浏览器时区
      - TZ=${TZ}                                         # 设置时区
      - GF_PATHS_DATA=/var/lib/grafana                   # 数据目录
      - GF_PATHS_PROVISIONING=/etc/grafana/provisioning  # 配置目录
      - GF_DASHBOARDS_MIN_REFRESH_INTERVAL=30s           # 仪表盘最小刷新间隔
      - GF_USERS_ALLOW_SIGN_UP=false                     # 禁止用户注册
      - GF_AUTH_ANONYMOUS_ENABLED=false                  # 禁用匿名访问
    deploy:
      resources:
        limits:
          memory: ${GRAFANA_MEMORY_LIMIT}
          cpus: '${GRAFANA_CPU_LIMIT}'
        reservations:
          memory: ${GRAFANA_MEMORY_RESERVATION}
          cpus: '${GRAFANA_CPU_RESERVATION}'
    healthcheck:
      test: [ "CMD", "wget", "-q", "--spider", "http://localhost:3000/api/health" ]
      interval: ${HEALTHCHECK_INTERVAL}
      timeout: ${HEALTHCHECK_TIMEOUT}
      retries: ${HEALTHCHECK_RETRIES}
    restart: unless-stopped
    logging:
      driver: "json-file"
      options:
        max-size: "${MAIN_SERVICE_LOG_MAX_SIZE}"
        max-file: "${MAIN_SERVICE_LOG_MAX_FILE}"
    depends_on:
      prometheus:
        condition: service_healthy
    networks:
      - bzl

  # ----------------------------------------
  # Node Exporter:系统指标收集器
  #
  # 功能:
  # - 收集主机级别的系统指标
  # - 监控CPU、内存、磁盘、网络等
  #
  # 配置说明:
  # - 文件系统:只读方式挂载系统目录
  # - 安全性:排除敏感挂载点
  # - 资源限制:256M内存/0.2CPU
  # ----------------------------------------
  node-exporter:
    image: prom/node-exporter
    container_name: node-exporter
    env_file: .env
    ports:
      - "${NODE_EXPORTER_PORT}:9100"  # 指标暴露端口
    volumes:
      - /proc:/host/proc:ro    # 只读挂载proc文件系统
      - /sys:/host/sys:ro      # 只读挂载sys文件系统
      - /:/rootfs:ro           # 只读挂载根文件系统
    command:
      - "--path.procfs=/host/proc"
      - "--path.sysfs=/host/sys"
      - "--path.rootfs=/rootfs"
      - "--collector.filesystem.mount-points-exclude=^/(sys|proc|dev|host|etc)($$|/)"  # 排除特定挂载点
    deploy:
      resources:
        limits:
          memory: ${EXPORTER_MEMORY_LIMIT}
          cpus: '${EXPORTER_CPU_LIMIT}'
        reservations:
          memory: ${EXPORTER_MEMORY_RESERVATION}
          cpus: '${EXPORTER_CPU_RESERVATION}'
    healthcheck:
      test: [ "CMD", "wget", "-q", "--spider", "http://localhost:9100/metrics" ]
      interval: ${HEALTHCHECK_INTERVAL}
      timeout: ${HEALTHCHECK_TIMEOUT}
      retries: ${HEALTHCHECK_RETRIES}
    restart: unless-stopped
    logging:
      driver: "json-file"
      options:
        max-size: "${OTHER_SERVICE_LOG_MAX_SIZE}"
        max-file: "${OTHER_SERVICE_LOG_MAX_FILE}"
    networks:
      - bzl

  # ----------------------------------------
  # Redis Exporter:Redis监控收集器
  #
  # 功能:
  # - 收集Redis服务器性能指标
  # - 监控连接数、命令执行、内存使用等
  #
  # 配置说明:
  # - 连接超时:30秒
  # - 日志格式:JSON
  # - 资源限制:256M内存/0.2CPU
  # ----------------------------------------
  redis-exporter:
    image: oliver006/redis_exporter
    container_name: redis-exporter
    env_file: .env
    environment:
      - REDIS_ADDR=${REDIS_ADDR}                    # Redis连接地址
      - REDIS_PASSWORD=${REDIS_PASSWORD}            # Redis密码
      - REDIS_EXPORTER_LOG_FORMAT=json              # 日志格式
      - REDIS_EXPORTER_WEB_LISTEN_ADDRESS=0.0.0.0:9121  # 监听地址
      - REDIS_EXPORTER_CONNECTION_TIMEOUT=30s       # 连接超时时间
    ports:
      - "${REDIS_EXPORTER_PORT}:9121"  # 指标暴露端口
    deploy:
      resources:
        limits:
          memory: ${EXPORTER_MEMORY_LIMIT}
          cpus: '${EXPORTER_CPU_LIMIT}'
        reservations:
          memory: ${EXPORTER_MEMORY_RESERVATION}
          cpus: '${EXPORTER_CPU_RESERVATION}'
    # 暂时禁用健康检查,因为基础镜像中没有wget/curl工具
    restart: unless-stopped
    logging:
      driver: "json-file"
      options:
        max-size: "${OTHER_SERVICE_LOG_MAX_SIZE}"
        max-file: "${OTHER_SERVICE_LOG_MAX_FILE}"
    networks:
      - bzl

  # ----------------------------------------
  # Elasticsearch Exporter:ES监控收集器
  #
  # 功能:
  # - 收集ES集群性能指标
  # - 监控节点状态、索引性能、查询延迟等
  #
  # 配置说明:
  # - 监控范围:全量指标、索引指标、分片信息
  # - 超时设置:30秒
  # - 资源限制:256M内存/0.2CPU
  # ----------------------------------------
  elasticsearch-exporter:
    image: quay.io/prometheuscommunity/elasticsearch-exporter:latest
    container_name: elasticsearch-exporter
    env_file: .env
    command:
      - "--es.uri=${ES_URI}"              # ES服务器地址
      - "--es.all"                        # 收集所有指标
      - "--es.indices"                    # 收集索引指标
      - "--es.indices_settings"           # 收集索引设置
      - "--es.shards"                     # 收集分片信息
      - "--es.timeout=30s"                # 请求超时时间
      - "--web.listen-address=0.0.0.0:9114"  # 监听地址
      - "--web.telemetry-path=/metrics"      # 指标路径
    ports:
      - "${ES_EXPORTER_PORT}:9114"  # 指标暴露端口
    deploy:
      resources:
        limits:
          memory: ${EXPORTER_MEMORY_LIMIT}
          cpus: '${EXPORTER_CPU_LIMIT}'
        reservations:
          memory: ${EXPORTER_MEMORY_RESERVATION}
          cpus: '${EXPORTER_CPU_RESERVATION}'
    healthcheck:
      test: [ "CMD", "wget", "-q", "--spider", "http://localhost:9114/metrics" ]
      interval: ${HEALTHCHECK_INTERVAL}
      timeout: ${HEALTHCHECK_TIMEOUT}
      retries: ${HEALTHCHECK_RETRIES}
    restart: unless-stopped
    logging:
      driver: "json-file"
      options:
        max-size: "${OTHER_SERVICE_LOG_MAX_SIZE}"
        max-file: "${OTHER_SERVICE_LOG_MAX_FILE}"
    networks:
      - bzl

  # ----------------------------------------
  # OpenGauss Exporter:数据库监控收集器
  #
  # 功能:
  # - 收集OpenGauss数据库性能指标
  # - 监控连接数、查询性能、资源使用等
  #
  # 配置说明:
  # - 日志级别:info
  # - 指标路径:/metrics
  # - 资源限制:256M内存/0.2CPU
  # ----------------------------------------
  opengauss-exporter:
    image: enmotech/opengauss_exporter
    container_name: opengauss-exporter
    env_file: .env
    environment:
      - DATA_SOURCE_NAME=${OPENGAUSS_DSN}  # 数据库连接字符串
    ports:
      - "${OPENGAUSS_EXPORTER_PORT}:9187"  # 指标暴露端口
    command:
      - '--web.listen-address=:9187'       # 监听地址
      - '--web.telemetry-path=/metrics'    # 指标路径
      - '--log.level=info'                # 日志级别
    deploy:
      resources:
        limits:
          memory: ${EXPORTER_MEMORY_LIMIT}
          cpus: '${EXPORTER_CPU_LIMIT}'
        reservations:
          memory: ${EXPORTER_MEMORY_RESERVATION}
          cpus: '${EXPORTER_CPU_RESERVATION}'
    # 暂时禁用健康检查,因为基础镜像中没有wget/curl工具
    restart: unless-stopped
    logging:
      driver: "json-file"
      options:
        max-size: "${OTHER_SERVICE_LOG_MAX_SIZE}"
        max-file: "${OTHER_SERVICE_LOG_MAX_FILE}"
    networks:
      - bzl

  # OpenGauss DBMind:用于监控OpenGauss数据库
  # opengauss-dbmind:
  #   image: dbmind/opengauss_dbmind
  #   container_name: opengauss-dbmind
  #   environment:
  #     # 配置多个监控源,包括主要业务库和系统库
  #     - OPENGAUSS_DSNS=dbname=postgres user=dbmind_monitor password=DBMind@123 port=5432 host=10.2.7.113, dbname=db_bzl user=dbmind_monitor password=DBMind@123 port=5432 host=10.2.7.113
  #     # 指定 node-exporter 地址
  #     - NODE_EXPORTERS=http://node-exporter:9100
  #     # 使用 metadatabase 作为元数据库
  #     - METADATABASE=postgresql://dbmind_monitor:DBMind%40123@10.2.7.113:5432/metadatabase
  #     - SCRAPE_INTERVAL=15
  #     # 管理员用户配置
  #     - MASTER_USER=dbmind_sys
  #     - MASTER_USER_PWD=DBMind@123
  #   volumes:
  #     - /home/docker_volums/dbmind_volumes/data:/data
  #     - /home/docker_volums/dbmind_volumes/log:/log
  #   ports:
  #     - "38080:8080"  # DBMind Web服务端口
  #     - "19090:9090"  # Prometheus端口1
  #     - "10001:10001" # OpenGauss Exporter端口1
  #     - "10002:10002" # OpenGauss Exporter端口2
  #     - "8181:8181"   # Reprocessing Exporter端口
  #   networks:
  #     - bzl

  # ----------------------------------------
  # Nginx Exporter:Nginx监控收集器
  #
  # 功能:
  # - 收集Nginx服务器性能指标
  # - 监控连接数、请求率、错误率等
  #
  # 配置说明:
  # - 状态页:通过环境变量配置
  # - 资源限制:256M内存/0.2CPU
  # ----------------------------------------
  nginx-exporter:
    image: nginx/nginx-prometheus-exporter
    container_name: nginx-exporter
    env_file: .env
    ports:
      - "${NGINX_EXPORTER_PORT}:9113"  # 指标暴露端口
    command:
      - "--nginx.scrape-uri=${NGINX_STATUS_URL}"  # Nginx状态页面地址
      - "--web.listen-address=:9113"              # 明确指定监听地址
    deploy:
      resources:
        limits:
          memory: ${EXPORTER_MEMORY_LIMIT}
          cpus: '${EXPORTER_CPU_LIMIT}'
        reservations:
          memory: ${EXPORTER_MEMORY_RESERVATION}
          cpus: '${EXPORTER_CPU_RESERVATION}'
    # 暂时禁用健康检查,因为基础镜像中没有wget/curl工具
    restart: unless-stopped
    logging:
      driver: "json-file"
      options:
        max-size: "${OTHER_SERVICE_LOG_MAX_SIZE}"
        max-file: "${OTHER_SERVICE_LOG_MAX_FILE}"
    networks:
      - bzl

  # ----------------------------------------
  # cAdvisor:容器监控收集器
  #
  # 功能:
  # - 收集Docker容器性能指标
  # - 监控CPU、内存、网络、磁盘等使用情况
  # - 提供容器资源使用的历史数据
  #
  # 配置说明:
  # - 权限:需要特权模式访问系统资源
  # - 挂载:只读方式挂载系统目录
  # - 资源限制:512M内存/0.5CPU
  # ----------------------------------------
  cadvisor:
    image: gcr.io/cadvisor/cadvisor:${CADVISOR_VERSION}
    container_name: cadvisor
    env_file: .env
    privileged: true  # 需要特权模式访问系统资源
    devices:
      - /dev/kmsg:/dev/kmsg  # 访问系统日志
    volumes:
      - /:/rootfs:ro                     # 只读方式挂载根文件系统
      - /var/run:/var/run:ro             # 访问容器运行时信息
      - /sys:/sys:ro                     # 访问系统信息
      - /var/lib/docker/:/var/lib/docker:ro  # 访问Docker数据
      - /dev/disk/:/dev/disk:ro          # 访问磁盘信息
    ports:
      - "${CADVISOR_PORT}:8080"  # Web界面端口映射
    environment:
      - TZ=${TZ}                         # 设置时区
      - CADVISOR_HEALTHCHECK_URL=http://localhost:8080/healthz  # 健康检查URL
    deploy:
      resources:
        limits:
          memory: 512M
          cpus: '0.5'
        reservations:
          memory: 256M
          cpus: '0.2'
    healthcheck:
      test: [ "CMD", "wget", "-q", "--spider", "http://localhost:8080/healthz" ]
      interval: ${HEALTHCHECK_INTERVAL}
      timeout: ${HEALTHCHECK_TIMEOUT}
      retries: ${HEALTHCHECK_RETRIES}
    restart: unless-stopped
    logging:
      driver: "json-file"
      options:
        max-size: "${CADVISOR_LOG_MAX_SIZE}"
        max-file: "${CADVISOR_LOG_MAX_FILE}"
    networks:
      - bzl

# ----------------------------------------
# 网络配置
#
# 说明:
# - 使用已存在的外部网络bzl
# - 确保所有服务可以相互通信
# - 支持服务间的服务发现
# ----------------------------------------
networks:
  bzl:
    name: bzl
external: true # 使用外部已存在的网络# ----------------------------------------
# 全局设置
# ----------------------------------------
# 设置时区为中国标准时间
TZ=Asia/Shanghai
# Docker数据卷的根目录,用于持久化存储
DOCKER_VOLUME_ROOT=/home/docker_volums
# ----------------------------------------
# Prometheus配置
# ----------------------------------------
# Prometheus Web界面端口,映射到主机的9091端口
PROMETHEUS_PORT=9091
# 监控数据保留时间,超过此时间的数据会被自动删除
PROMETHEUS_RETENTION_TIME=15d
# 监控数据存储大小限制,超过此大小会删除最旧的数据
PROMETHEUS_RETENTION_SIZE=5GB
# Prometheus数据存储目录,用于持久化数据
PROMETHEUS_DATA_DIR=${DOCKER_VOLUME_ROOT}/prometheus_volumes/data
# ----------------------------------------
# Grafana配置
# ----------------------------------------
# Grafana Web界面端口
GRAFANA_PORT=3000
# Grafana管理员用户名
GRAFANA_ADMIN_USER=admin
# Grafana管理员密码
GRAFANA_ADMIN_PASSWORD=admin123
# Grafana数据目录,存储仪表盘、用户等信息
GRAFANA_DATA_DIR=${DOCKER_VOLUME_ROOT}/grafana_volumes
# Grafana配置目录,存储数据源、仪表盘等配置
GRAFANA_PROVISIONING_DIR=${DOCKER_VOLUME_ROOT}/grafana_volumes/provisioning
# ----------------------------------------
# Node Exporter配置
# ----------------------------------------
# Node Exporter端口,用于收集主机系统指标
NODE_EXPORTER_PORT=9100
# ----------------------------------------
# Redis Exporter配置
# ----------------------------------------
# Redis Exporter端口,用于暴露Redis监控指标
REDIS_EXPORTER_PORT=9121
# Redis服务器连接地址
REDIS_ADDR=redis://10.2.7.113:6379
# Redis服务器密码
REDIS_PASSWORD=你的redis密码
# ----------------------------------------
# Elasticsearch Exporter配置
# ----------------------------------------
# Elasticsearch Exporter端口,用于暴露ES监控指标
ES_EXPORTER_PORT=9114
# Elasticsearch服务器地址
ES_URI=http://elasticsearch:9200
# ----------------------------------------
# OpenGauss Exporter配置
# ----------------------------------------
# OpenGauss Exporter端口,用于暴露数据库监控指标
OPENGAUSS_EXPORTER_PORT=9187
# OpenGauss数据库连接字符串
# 格式:postgresql://用户名:密码@主机:端口/数据库名?sslmode=disable
OPENGAUSS_DSN=postgresql://dbuser_monitor:Mon@1234@10.2.7.113:5432/postgres?sslmode=disable
# ----------------------------------------
# Nginx Exporter配置
# ----------------------------------------
# Nginx Exporter端口,用于暴露Nginx监控指标
NGINX_EXPORTER_PORT=9113
# Nginx status页面地址,用于获取Nginx状态信息
NGINX_STATUS_URL=http://bzl_front:8080/nginx_status
# ----------------------------------------
# cAdvisor配置
# ----------------------------------------
# cAdvisor Web界面端口,用于查看容器监控信息
CADVISOR_PORT=8090
# cAdvisor版本号,建议使用稳定版本
CADVISOR_VERSION=v0.49.2
# 容器日志文件大小限制
CADVISOR_LOG_MAX_SIZE=100m
# 容器日志文件保留个数
CADVISOR_LOG_MAX_FILE=3
# ----------------------------------------
# 资源限制配置
# ----------------------------------------
# Prometheus资源限制
PROMETHEUS_MEMORY_LIMIT=2G
PROMETHEUS_CPU_LIMIT=1
PROMETHEUS_MEMORY_RESERVATION=1G
PROMETHEUS_CPU_RESERVATION=0.5
# Grafana资源限制
GRAFANA_MEMORY_LIMIT=1G
GRAFANA_CPU_LIMIT=0.5
GRAFANA_MEMORY_RESERVATION=512M
GRAFANA_CPU_RESERVATION=0.2
# Exporters资源限制(适用于所有Exporter)
EXPORTER_MEMORY_LIMIT=256M
EXPORTER_CPU_LIMIT=0.2
EXPORTER_MEMORY_RESERVATION=128M
EXPORTER_CPU_RESERVATION=0.1
# ----------------------------------------
# 日志配置
# ----------------------------------------
# 主要服务(Prometheus/Grafana)日志配置
MAIN_SERVICE_LOG_MAX_SIZE=100m
MAIN_SERVICE_LOG_MAX_FILE=3
# 其他服务日志配置
OTHER_SERVICE_LOG_MAX_SIZE=50m
OTHER_SERVICE_LOG_MAX_FILE=3
# ----------------------------------------
# 健康检查配置
# ----------------------------------------
# 健康检查间隔时间
HEALTHCHECK_INTERVAL=30s
# 健康检查超时时间
HEALTHCHECK_TIMEOUT=10s
# 健康检查重试次数
HEALTHCHECK_RETRIES=3# 全局配置
global:
scrape_interval: 15s # 改为15秒
evaluation_interval: 15s # 改为15秒
# 告警规则文件
rule_files:
- "minio-alerting.yml"
# 抓取配置:定义所有监控目标
scrape_configs:
# 监控Prometheus自身
- job_name: "prometheus"
static_configs:
- targets: [ "prometheus:9090" ]
# 监控主机系统指标
- job_name: "node"
static_configs:
- targets: [ "node-exporter:9100" ]
labels:
instance: "linux-server"
# 监控Redis指标
- job_name: "redis"
static_configs:
- targets: [ "redis-exporter:9121" ]
# 监控MinIO指标
- job_name: minio-cluster
bearer_token: eyJhbGciOiJIUzUxMiIsInR5cCI6IkpXVCJ9.eyJpc3MiOiJwcm9tZXRoZXVzIiwic3ViIjoibWluaW9hZG1pbiIsImV4cCI6NDg4OTc0MDk1NX0.lPc0ta75MYOtHwjj5lXmYI-pTGA-R7D3D5QbJIN81WHXNtVw-64KneLZbACM9cS_9oyvRbpmSJl_nLa1cy_2vA
metrics_path: /minio/v2/metrics/cluster
scheme: http
static_configs:
- targets: [ "minio:9000" ]
# 监控Elasticsearch指标
- job_name: "elasticsearch"
static_configs:
- targets: [ "elasticsearch-exporter:9114" ]
# 监控OpenGauss指标 (官方exporter)
- job_name: "opengauss-official"
metrics_path: /metrics
scheme: http
static_configs:
- targets: [ "opengauss-exporter:9187" ]
labels:
instance: "opengauss-official"
# 监控OpenGauss指标
# - job_name: "opengauss"
# scrape_interval: 15s
# metrics_path: /metrics
# scheme: http
# fallback_scrape_protocol: "PrometheusText0.0.4"
# static_configs:
# - targets:
# - "opengauss-dbmind:10001"
# - "opengauss-dbmind:10002"
# labels:
# instance: "opengauss-main"
# 监控JVM指标
- job_name: "jmx"
metrics_path: "/metrics"
scheme: http
static_configs:
- targets: [ "bzl_backend:9404" ]
# labels:
# instance: "bzl.domain.com[bzl_backend]"
# actuator监控Java应用
# - job_name: "application"
# metrics_path: "/bzl-boot/actuator/prometheus"
# scheme: http
# follow_redirects: true
# static_configs:
# - targets: ["host.docker.internal:8083"]
# 监控Nginx指标
- job_name: "nginx"
static_configs:
- targets: [ "nginx-exporter:9113" ]
# 监控Docker容器指标
- job_name: "docker"
metrics_path: /metrics
scheme: http
static_configs:
- targets: [ "cadvisor:8080" ]
labels:
instance: "docker-metrics"
service: "cadvisor"
environment: "prod"
metric_relabel_configs:
# 保留重要的容器标签
- source_labels: [ container_label_com_docker_compose_service ]
target_label: service_name
- source_labels: [ container_label_com_docker_compose_project ]
target_label: project_name
# 移除一些不必要的标签以减少存储空间
- regex: "container_label_.*"
action: labeldrop
- regex: "id"
action: labeldropstartDelaySeconds: 0
ssl: false
# 下面这两可以不写()
lowercaseOutputName: false
lowercaseOutputLabelNames: false
rules:
- pattern: ".*"单独接入的案例详解
接入springboot
在启动的时候以javaagent的方式启动jmx_export
# 使用 OpenJDK 作为基础镜像
FROM openjdk:8
# 作者信息
LABEL maintainer="bzl"

# 设置时区
RUN ln -sf /usr/share/zoneinfo/Asia/Shanghai /etc/localtime

# 创建必要的目录
RUN mkdir -p /app/logs /app/uploadtmp /app

# 设置工作目录
WORKDIR /app

# 将构建的 jar 文件和 javaagent jar 添加到容器中
COPY ./web/target/bzl-boot-1.0.0.jar ./bzl-boot-1.0.0.jar
COPY ./prometheus/jmx_prometheus_javaagent-1.1.0.jar ./jmx_prometheus_javaagent-1.1.0.jar
COPY ./prometheus/jmx_config.yaml ./jmx_config.yaml

# 暴露应用的端口(后端端口和jmx端口)
EXPOSE 8083 9404

# 设置容器启动时执行的命令,添加 javaagent 参数
CMD ["java", \
    "-javaagent:/app/jmx_prometheus_javaagent-1.1.0.jar=9404:/app/jmx_config.yaml", \
    "-Djava.io.tmpdir=/app/uploadtmp", \
    "-Duser.timezone=GMT+08", \
    "-Dspring.profiles.active=prod", \
"-jar", "bzl-boot-1.0.0.jar"]services:
bzl_backend:
build:
context: .
dockerfile: Dockerfile
image: bzl_boot:1.0
container_name: bzl_backend
ports:
- "8083:8083"
- "9404:9404"
networks:
- bzl
networks:
bzl: # 定义共享网络
name: bzl# JMX Exporter 基础配置
startDelaySeconds: 0 # JMX Exporter启动延迟时间(秒)
ssl: false # 是否使用SSL连接
rules:
- pattern: ".*" # 监控JVM指标
- job_name: "jmx"
metrics_path: "/metrics"
scheme: http
static_configs:
- targets: [ "bzl_backend:9404" ]接入nginx
nginx-prometheus-exporter仪表盘文档
services:
  nginx-exporter:
    image: nginx/nginx-prometheus-exporter
    container_name: nginx-exporter
    ports:
      - "9113:9113"
    command:
      - "--nginx.scrape-uri=http://bzl_front:8080/nginx_status"
    restart: unless-stopped
    networks:
      - bzl

networks:
  bzl: # 定义共享网络
name: bzlscrape_configs:
- job_name: "nginx"
static_configs:
- targets: [ "nginx-exporter:9113" ]# 放行数据监控接口
server {
listen 8080;
server_name _;
# Nginx status page
location /nginx_status {
stub_status on;
access_log off;
allow 127.0.0.1;
allow 172.16.0.0/12; # Docker network
allow 192.168.0.0/16; # Local network
deny all;
}
}接入minio
使用 Prometheus 进行监控和警报 — 适用于 Linux 的 MinIO 对象存储
注意
下面的命令中需要替换的参数:
- 网络
host - 数据卷
/home/docker_volums/mc_volumes - 别名
source
创建minio的别名(mc链接minio)这里的source是别名
docker run --rm --network host -v /home/docker_volums/mc_volumes:/root/.mc minio/mc alias set source http://minio:9000 minioadmin minioadmin生成minio监控的job数据 需要查看官方文档来修改监听方式,此处我的是默认(cluster)
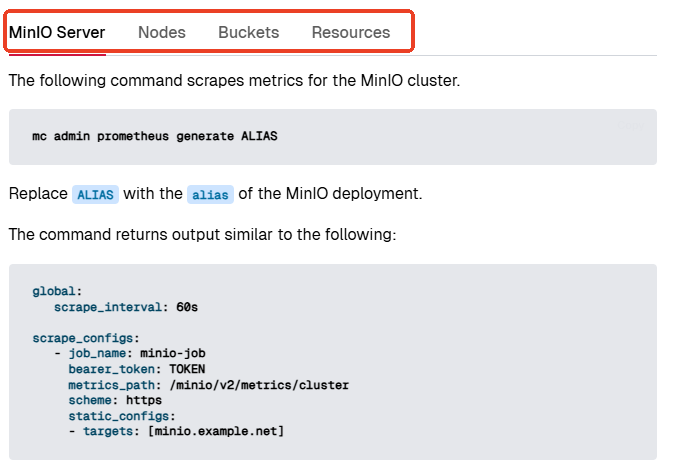
docker run --rm --network host -v /home/docker_volums/mc_volumes:/root/.mc minio/mc admin prometheus generate source生成的例子(生成后将其粘贴到prometheus.yml中即可,注意缩进)
- job_name: minio-cluster
    bearer_token: eyJhbGciOiJIUzUxMiIsInR5cCI6IkpXVCJ9.eyJpc3MiOiJwcm9tZXRoZXVzIiwic3ViIjoibWluaW9hZG1pbiIsImV4cCI6NDg4OTc0MDk1NX0.lPc0ta75MYOtHwjj5lXmYI-pTGA-R7D3D5QbJIN81WHXNtVw-64KneLZbACM9cS_9oyvRbpmSJl_nLa1cy_2vA
    metrics_path: /minio/v2/metrics/cluster
    scheme: http
    static_configs:
- targets: [ "minio:9000" ]minio-alerting.yml
groups:
  - name: minio-alerts
    rules:
      - alert: NodesOffline
        expr: avg_over_time(minio_cluster_nodes_offline_total{job="minio-job"}[5m]) > 0
        for: 10m
        labels:
          severity: warn
        annotations:
          summary: "MinIO节点离线警告"
          description: "集群 {{ $labels.instance }} 中的节点已离线超过5分钟"

      - alert: DisksOffline
        expr: avg_over_time(minio_cluster_drive_offline_total{job="minio-job"}[5m]) > 0
        for: 10m
        labels:
          severity: warn
        annotations:
          summary: "MinIO磁盘离线警告"
description: "集群 {{ $labels.instance }} 中的磁盘已离线超过5分钟"接入opengauss
简介
可以使用两种方法导出opengauss的监控数据
- opengauss-exporter(一个官方组件仓库)
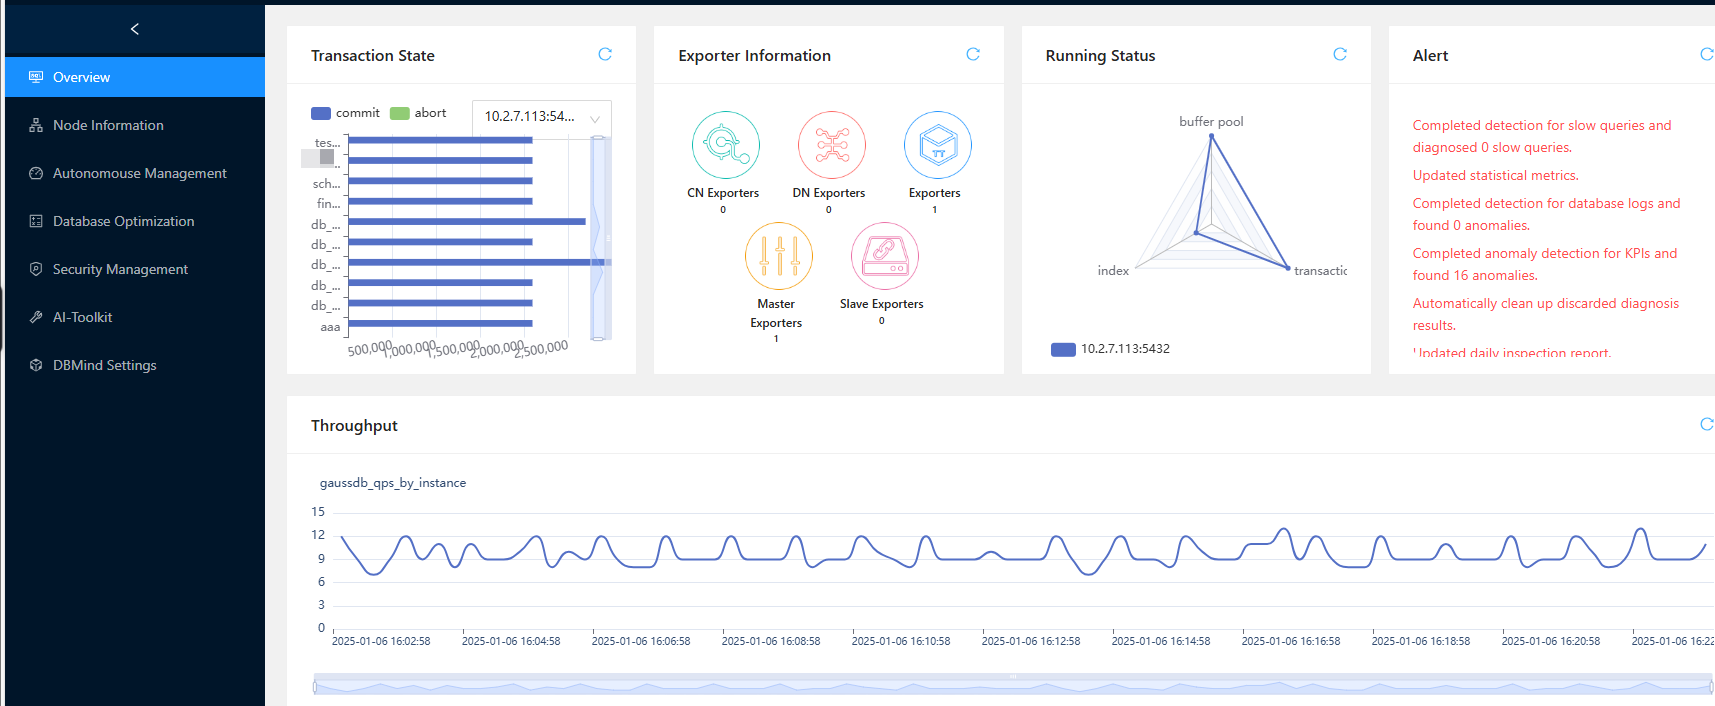
- DBMind(官方工具,其中包含opengauss-exporter组件)
opengauss-exporter
openGauss-prometheus-exporter文档
登录(需要用管理员用户登录进去创建)
gsql -d postgres -p 5432 -U 管理员用户账号创建监控用户
CREATE USER dbuser_monitor with login monadmin PASSWORD 'Mon@1234';
grant usage on schema dbe_perf to dbuser_monitor;
grant select on pg_stat_replication to dbuser_monitor; # OpenGauss Exporter:使用官方exporter监控OpenGauss
opengauss-exporter:
image: enmotech/opengauss_exporter
container_name: opengauss-exporter
environment:
- DATA_SOURCE_NAME=postgresql://dbuser_monitor:Mon@1234@10.2.7.113:5432/postgres?sslmode=disable
ports:
- "9187:9187"
command:
- '--web.listen-address=:9187'
- '--web.telemetry-path=/metrics'
- '--log.level=debug'
restart: unless-stopped
networks:
- bzl # 监控OpenGauss指标 (官方exporter)
- job_name: "opengauss-official"
scrape_interval: 15s
metrics_path: /metrics
static_configs:
- targets: [ "opengauss-exporter-official:9187" ]
labels:
instance: "opengauss-official"DBMind
创建数据库用于监控的用户
账号为:
dbmind_monitor和dbmind_sys;密码为:DBMind@123
-- 创建监控用户dbmind_monitor并设置密码,赋予monadmin权限
CREATE USER dbmind_monitor WITH PASSWORD 'DBMind@123';
ALTER USER dbmind_monitor monadmin;

-- 创建管理用户(用于执行管理操作),赋予sysadmin权限
CREATE USER dbmind_sys WITH PASSWORD 'DBMind@123';
ALTER USER dbmind_sys sysadmin;

-- 创建元数据库和用户
CREATE DATABASE dbmind_metadb;
CREATE USER dbmind_metadb WITH PASSWORD 'DBMind@123';
GRANT ALL PRIVILEGES ON DATABASE dbmind_metadb TO dbmind_metadb;其中dbmind_monitor负责从openGauss数据库中抓取指标监控,需要具备monitor admin权限;dbmind_sys至少需要具备 monitor admin权限,以便可以获取数据库的即时状态,如果具备sysadmin权限,则可以完成一些数据库变更动作,如慢SQL查杀; dbmind_metadb只是负责数据保存,具备指定数据库的使用权限即可
  opengauss-dbmind:
    image: dbmind/opengauss_dbmind
    container_name: opengauss-dbmind
    environment:
      - OPENGAUSS_DSNS=dbname=postgres user=dbmind_monitor password=DBMind@123 port=5432 host=10.2.7.113
      - NODE_EXPORTERS=http://node-exporter:9100
      - SCRAPE_INTERVAL=15
      - MASTER_USER=dbmind_sys
      - MASTER_USER_PWD=DBMind@123
    ports:
      - "38080:8080"  # DBMind Web服务端口
      - "9187:9090"   # Prometheus端口(用于收集指标)
    volumes:
      - /home/docker_volums/dbmind_volumes/data:/data  # 持久化数据
      - /home/docker_volums/dbmind_volumes/log:/log    # 日志目录
    networks:
- bzl # 监控OpenGauss指标
- job_name: "opengauss"
scrape_interval: 15s
metrics_path: /metrics
static_configs:
- targets: [ "opengauss-dbmind:9090" ]
labels:
instance: "opengauss-main"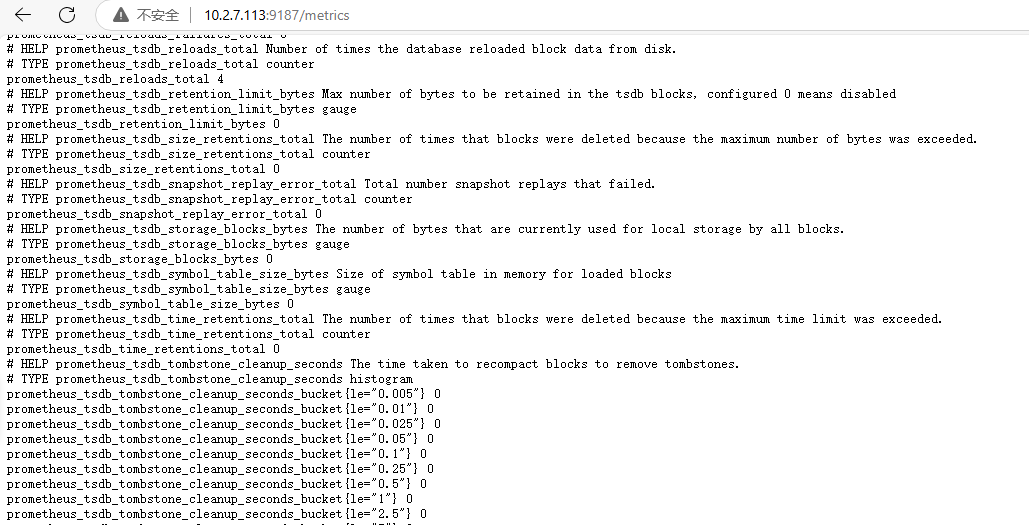
dbMind的地址为:http://10.2.7.113:38080/
删除用户和数据库的方法
删除用户
假设要删除的用户为
dbmind_monitor
查询所有用户
SELECT * FROM pg_user;删除该用户(如果执行失败,请先执行下面两条语句,将权限取消后再删除用户)
DROP USER IF EXISTS dbmind_monitor;切换到dbmind_metadb数据库
\c dbmind_metadb;去除该用户在该数据库的所有权限
REVOKE ALL ON DATABASE dbmind_metadb FROM dbmind_monitor;删除数据库(如果需要把这个库也删除的话)
DROP DATABASE IF EXISTS dbmind_metadb;如果删不掉,请尝试下面两个语句后再删除(如果有项目占用这个数据库,或者有其他人在链接这个数据库,那这个数据库是删不掉的,需要断开这个数据库的所有连接后再删除)
-- 查看当前连接
SELECT pid, datname, usename, application_name, client_addr, state
FROM pg_stat_activity
WHERE datname = 'dbmind_metadb';

-- 强制断开 metadatabase 的所有连接
CLEAN CONNECTION TO ALL FORCE FOR DATABASE dbmind_metadb;接入docker
google/cadvisor 分析正在运行的容器的资源使用情况和性能特征
  # cAdvisor:用于收集Docker容器指标
  cadvisor:
    image: gcr.io/cadvisor/cadvisor:v0.49.2
    container_name: cadvisor
    privileged: true  # 需要特权模式来访问系统资源
    devices:
      - /dev/kmsg:/dev/kmsg
    volumes:
      - /:/rootfs:ro                     # 只读方式挂载根文件系统
      - /var/run:/var/run:ro             # 访问容器运行时信息
      - /sys:/sys:ro                     # 访问系统信息
      - /var/lib/docker/:/var/lib/docker:ro  # 访问Docker数据
      - /dev/disk/:/dev/disk:ro          # 访问磁盘信息
    ports:
      - "8090:8080"  # 修改为8090避免与其他服务冲突
    environment:
      - TZ=Asia/Shanghai
      - CADVISOR_HEALTHCHECK_URL=http://localhost:8080/healthz  # 健康检查URL
    healthcheck:
      test: [ "CMD", "wget", "-q", "--spider", "http://localhost:8080/healthz" ]
      interval: 30s
      timeout: 10s
      retries: 3
    restart: unless-stopped
    networks:
      - bzl
    logging:
      driver: "json-file"
      options:
        max-size: "100m"
max-file: "3" # 监控Docker容器指标
- job_name: "docker"
scrape_interval: 5s # Docker容器指标采集间隔设置更短
metrics_path: /metrics
scheme: http
static_configs:
- targets: [ "cadvisor:8080" ]
labels:
instance: "docker-metrics"
service: "cadvisor"
environment: "prod"
metric_relabel_configs:
# 保留重要的容器标签
- source_labels: [ container_label_com_docker_compose_service ]
target_label: service_name
- source_labels: [ container_label_com_docker_compose_project ]
target_label: project_name
# 移除一些不必要的标签以减少存储空间
- regex: "container_label_.*"
action: labeldrop
- regex: "id"
action: labeldrop可能遇到的问题
读取不到job,导致数据无法显示

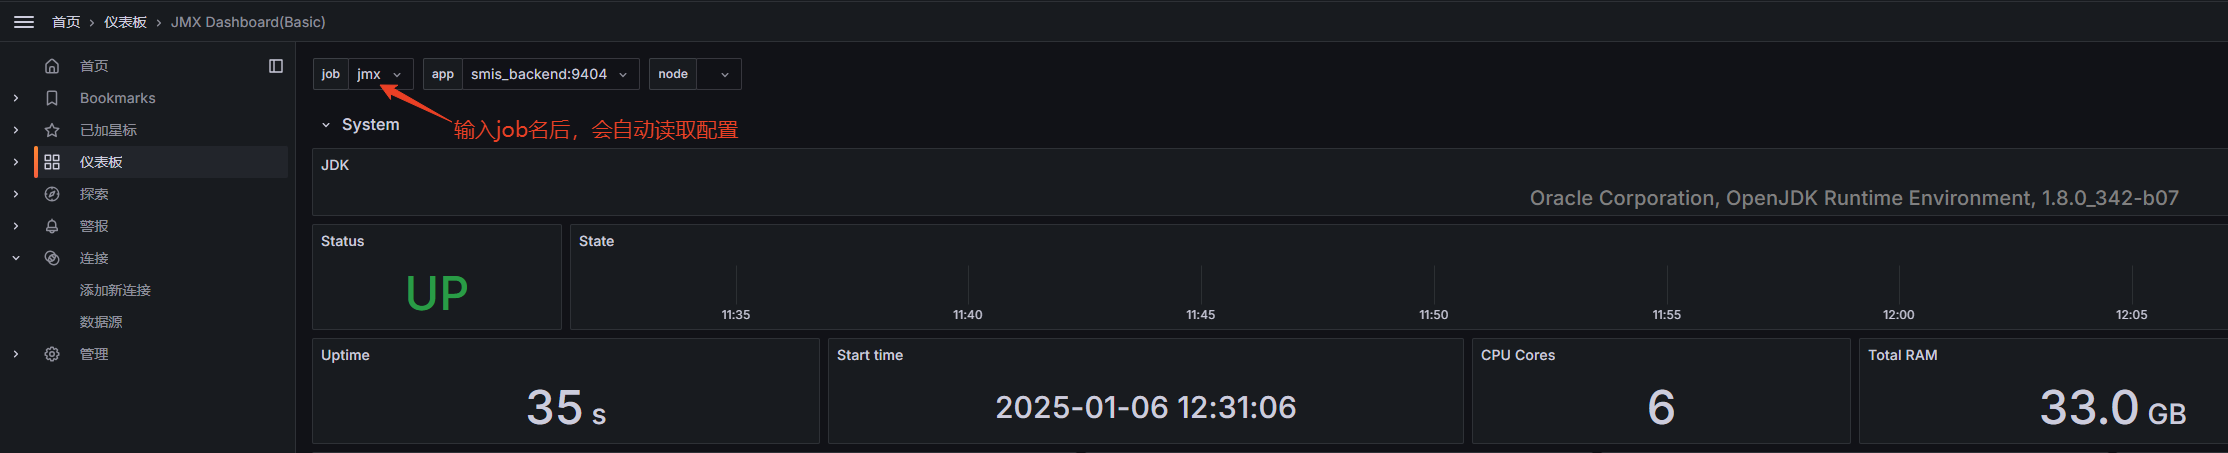
仪表盘
常用仪表盘
node_exporter(1860)
- 镜像:
prom/node-exporter - 仪表盘官网
redis(11835)
- 镜像:
oliver006/redis_exporter - 仪表盘官网
elasticsearch(14191)
- 镜像:
quay.io/prometheuscommunity/elasticsearch-exporter:latest) - 仪表盘官网
postgre(9628)
- 镜像:enmotech/opengauss_exporter)
- 仪表盘官网
jmx(14845)
不能使用actuator的话,就使用这个
这个仪表盘的一些字段太老了,需要自己修改一下
nginx
docker(19908)
jmx overview(3457)
- 镜像:
bitnami/jmx-exporter - 本次没用到,但是测试过了
- 仪表盘官网
jvm(4701)(本次没用到,但是测试过了)
- 仪表盘官网
- 需要在springboot中放行actuator的路径
- springboot配置文件需要在management.endpoints.web.exposure.include中加上
health,prometheus - 不建议用这个,这个需要使用actuator,actuator有提权漏洞
我的一些仪表盘配置
[jmx]、[nginx]
{
"__inputs": [
{
"name": "DS_PROMETHEUS",
"label": "prometheus",
"description": "",
"type": "datasource",
"pluginId": "prometheus",
"pluginName": "Prometheus"
}
],
"__elements": {},
"__requires": [
{
"type": "panel",
"id": "gauge",
"name": "Gauge",
"version": ""
},
{
"type": "grafana",
"id": "grafana",
"name": "Grafana",
"version": "11.4.0"
},
{
"type": "datasource",
"id": "prometheus",
"name": "Prometheus",
"version": "1.0.0"
},
{
"type": "panel",
"id": "stat",
"name": "Stat",
"version": ""
},
{
"type": "panel",
"id": "timeseries",
"name": "Time series",
"version": ""
}
],
"annotations": {
"list": [
{
"builtIn": 1,
"datasource": {
"type": "datasource",
"uid": "grafana"
},
"enable": true,
"hide": true,
"iconColor": "rgba(0, 211, 255, 1)",
"name": "Annotations & Alerts",
"target": {
"limit": 100,
"matchAny": false,
"tags": [],
"type": "dashboard"
},
"type": "dashboard"
}
]
},
"description": "jmx exporter monitor",
"editable": true,
"fiscalYearStartMonth": 0,
"graphTooltip": 0,
"id": null,
"links": [],
"panels": [
{
"collapsed": false,
"gridPos": {
"h": 1,
"w": 24,
"x": 0,
"y": 0
},
"id": 56,
"panels": [],
"title": "System",
"type": "row"
},
{
"datasource": {
"type": "prometheus",
"uid": "${DS_PROMETHEUS}"
},
"fieldConfig": {
"defaults": {
"color": {
"mode": "fixed"
},
"mappings": [],
"thresholds": {
"mode": "absolute",
"steps": [
{
"color": "green",
"value": null
}
]
}
},
"overrides": []
},
"gridPos": {
"h": 2,
"w": 24,
"x": 0,
"y": 1
},
"id": 72,
"options": {
"colorMode": "value",
"graphMode": "none",
"justifyMode": "auto",
"orientation": "auto",
"percentChangeColorMode": "standard",
"reduceOptions": {
"calcs": [],
"fields": "/^jdk$/",
"values": false
},
"showPercentChange": false,
"text": {
"valueSize": 20
},
"textMode": "value",
"wideLayout": true
},
"pluginVersion": "11.4.0",
"targets": [
{
"datasource": {
"type": "prometheus",
"uid": "${DS_PROMETHEUS}"
},
"disableTextWrap": false,
"editorMode": "builder",
"exemplar": true,
"expr": "label_join(jvm_runtime_info{job=\"$job\", instance=\"$app$node\"}, \"jdk\", \", \", \"vendor\", \"runtime\", \"version\")",
"format": "table",
"fullMetaSearch": false,
"includeNullMetadata": true,
"instant": false,
"interval": "",
"intervalFactor": 1,
"legendFormat": "",
"refId": "A",
"useBackend": false
}
],
"title": "JDK",
"type": "stat"
},
{
"datasource": {
"type": "prometheus",
"uid": "${DS_PROMETHEUS}"
},
"description": "",
"fieldConfig": {
"defaults": {
"color": {
"mode": "thresholds"
},
"mappings": [
{
"options": {
"0": {
"text": "DOWN"
},
"1": {
"text": "UP"
}
},
"type": "value"
},
{
"options": {
"match": "null",
"result": {
"text": "DOWN"
}
},
"type": "special"
}
],
"thresholds": {
"mode": "absolute",
"steps": [
{
"color": "#d44a3a",
"value": null
},
{
"color": "#299c46",
"value": 1
}
]
},
"unit": "none"
},
"overrides": []
},
"gridPos": {
"h": 3,
"w": 2,
"x": 0,
"y": 3
},
"id": 2,
"maxDataPoints": 100,
"options": {
"colorMode": "value",
"graphMode": "none",
"justifyMode": "auto",
"orientation": "horizontal",
"percentChangeColorMode": "standard",
"reduceOptions": {
"calcs": [
"lastNotNull"
],
"fields": "",
"values": false
},
"showPercentChange": false,
"text": {},
"textMode": "auto",
"wideLayout": true
},
"pluginVersion": "11.4.0",
"targets": [
{
"datasource": {
"type": "prometheus",
"uid": "${DS_PROMETHEUS}"
},
"exemplar": true,
"expr": "up{job=\"$job\", instance=\"$app$node\"}",
"format": "time_series",
"instant": true,
"interval": "",
"intervalFactor": 4,
"legendFormat": "Status",
"refId": "A"
}
],
"title": "Status",
"type": "stat"
},
{
"datasource": {
"type": "prometheus",
"uid": "${DS_PROMETHEUS}"
},
"fieldConfig": {
"defaults": {
"color": {
"mode": "palette-classic"
},
"custom": {
"axisBorderShow": false,
"axisCenteredZero": false,
"axisColorMode": "text",
"axisLabel": "",
"axisPlacement": "hidden",
"barAlignment": 0,
"barWidthFactor": 0.6,
"drawStyle": "bars",
"fillOpacity": 0,
"gradientMode": "none",
"hideFrom": {
"legend": false,
"tooltip": false,
"viz": false
},
"insertNulls": false,
"lineInterpolation": "linear",
"lineWidth": 1,
"pointSize": 5,
"scaleDistribution": {
"type": "linear"
},
"showPoints": "auto",
"spanNulls": false,
"stacking": {
"group": "A",
"mode": "none"
},
"thresholdsStyle": {
"mode": "off"
}
},
"mappings": [],
"max": 1,
"min": 0,
"thresholds": {
"mode": "absolute",
"steps": [
{
"color": "green",
"value": null
}
]
}
},
"overrides": [
{
"matcher": {
"id": "byType",
"options": "time"
},
"properties": [
{
"id": "custom.axisPlacement",
"value": "auto"
}
]
}
]
},
"gridPos": {
"h": 3,
"w": 22,
"x": 2,
"y": 3
},
"id": 120,
"options": {
"legend": {
"calcs": [],
"displayMode": "list",
"placement": "bottom",
"showLegend": false
},
"tooltip": {
"mode": "multi",
"sort": "none"
}
},
"pluginVersion": "11.4.0",
"targets": [
{
"datasource": {
"type": "prometheus",
"uid": "${DS_PROMETHEUS}"
},
"exemplar": true,
"expr": "up{job=\"$job\", instance=\"$app$node\"}",
"interval": "",
"legendFormat": "State",
"refId": "A"
}
],
"title": "State",
"type": "timeseries"
},
{
"datasource": {
"type": "prometheus",
"uid": "${DS_PROMETHEUS}"
},
"description": "",
"fieldConfig": {
"defaults": {
"color": {
"mode": "thresholds"
},
"decimals": 0,
"mappings": [
{
"options": {
"match": "null",
"result": {
"text": "N/A"
}
},
"type": "special"
}
],
"thresholds": {
"mode": "absolute",
"steps": [
{
"color": "green",
"value": null
}
]
},
"unit": "ms"
},
"overrides": []
},
"gridPos": {
"h": 3,
"w": 4,
"x": 0,
"y": 6
},
"id": 4,
"maxDataPoints": 100,
"options": {
"colorMode": "none",
"graphMode": "none",
"justifyMode": "auto",
"orientation": "horizontal",
"percentChangeColorMode": "standard",
"reduceOptions": {
"calcs": [
"lastNotNull"
],
"fields": "",
"values": false
},
"showPercentChange": false,
"text": {},
"textMode": "auto",
"wideLayout": true
},
"pluginVersion": "11.4.0",
"targets": [
{
"datasource": {
"type": "prometheus",
"uid": "${DS_PROMETHEUS}"
},
"exemplar": true,
"expr": "java_lang_Runtime_Uptime{job=\"$job\", instance=\"$app$node\"}",
"format": "time_series",
"instant": true,
"interval": "",
"intervalFactor": 1,
"legendFormat": "Uptime",
"refId": "A"
}
],
"title": "Uptime",
"type": "stat"
},
{
"datasource": {
"type": "prometheus",
"uid": "${DS_PROMETHEUS}"
},
"description": "",
"fieldConfig": {
"defaults": {
"color": {
"mode": "thresholds"
},
"mappings": [
{
"options": {
"match": "null",
"result": {
"text": "N/A"
}
},
"type": "special"
}
],
"thresholds": {
"mode": "absolute",
"steps": [
{
"color": "#299c46",
"value": null
}
]
},
"unit": "dateTimeAsIso"
},
"overrides": []
},
"gridPos": {
"h": 3,
"w": 5,
"x": 4,
"y": 6
},
"id": 6,
"maxDataPoints": 100,
"options": {
"colorMode": "none",
"graphMode": "none",
"justifyMode": "auto",
"orientation": "horizontal",
"percentChangeColorMode": "standard",
"reduceOptions": {
"calcs": [
"lastNotNull"
],
"fields": "",
"values": false
},
"showPercentChange": false,
"text": {
"valueSize": 30
},
"textMode": "value",
"wideLayout": true
},
"pluginVersion": "11.4.0",
"targets": [
{
"datasource": {
"type": "prometheus",
"uid": "${DS_PROMETHEUS}"
},
"exemplar": true,
"expr": "java_lang_Runtime_StartTime{job=\"$job\", instance=\"$app$node\"}",
"format": "time_series",
"instant": true,
"interval": "",
"intervalFactor": 1,
"legendFormat": "Start time",
"refId": "A"
}
],
"title": "Start time",
"type": "stat"
},
{
"datasource": {
"type": "prometheus",
"uid": "${DS_PROMETHEUS}"
},
"description": "",
"fieldConfig": {
"defaults": {
"color": {
"mode": "thresholds"
},
"mappings": [
{
"options": {
"match": "null",
"result": {
"text": "N/A"
}
},
"type": "special"
}
],
"thresholds": {
"mode": "absolute",
"steps": [
{
"color": "green",
"value": null
},
{
"color": "red",
"value": 80
}
]
},
"unit": "none"
},
"overrides": []
},
"gridPos": {
"h": 3,
"w": 3,
"x": 9,
"y": 6
},
"id": 12,
"maxDataPoints": 100,
"options": {
"colorMode": "none",
"graphMode": "none",
"justifyMode": "auto",
"orientation": "horizontal",
"percentChangeColorMode": "standard",
"reduceOptions": {
"calcs": [
"lastNotNull"
],
"fields": "",
"values": false
},
"showPercentChange": false,
"text": {},
"textMode": "auto",
"wideLayout": true
},
"pluginVersion": "11.4.0",
"targets": [
{
"datasource": {
"type": "prometheus",
"uid": "${DS_PROMETHEUS}"
},
"exemplar": true,
"expr": "java_lang_OperatingSystem_AvailableProcessors{job=\"$job\", instance=\"$app$node\"}",
"format": "time_series",
"instant": true,
"interval": "",
"intervalFactor": 1,
"legendFormat": "CPU Cores",
"refId": "A"
}
],
"title": "CPU Cores",
"type": "stat"
},
{
"datasource": {
"type": "prometheus",
"uid": "${DS_PROMETHEUS}"
},
"fieldConfig": {
"defaults": {
"color": {
"fixedColor": "text",
"mode": "fixed"
},
"mappings": [
{
"options": {
"match": "null",
"result": {
"text": "N/A"
}
},
"type": "special"
}
],
"thresholds": {
"mode": "absolute",
"steps": [
{
"color": "green",
"value": null
}
]
},
"unit": "decbytes"
},
"overrides": []
},
"gridPos": {
"h": 3,
"w": 4,
"x": 12,
"y": 6
},
"id": 46,
"maxDataPoints": 100,
"options": {
"colorMode": "value",
"graphMode": "none",
"justifyMode": "auto",
"orientation": "horizontal",
"percentChangeColorMode": "standard",
"reduceOptions": {
"calcs": [
"mean"
],
"fields": "",
"values": false
},
"showPercentChange": false,
"text": {},
"textMode": "auto",
"wideLayout": true
},
"pluginVersion": "11.4.0",
"targets": [
{
"datasource": {
"type": "prometheus",
"uid": "${DS_PROMETHEUS}"
},
"dsType": "influxdb",
"exemplar": true,
"expr": "java_lang_OperatingSystem_TotalPhysicalMemorySize{job=\"$job\", instance=\"$app$node\"}",
"format": "time_series",
"groupBy": [
{
"params": [
"$__interval"
],
"type": "time"
},
{
"params": [
"null"
],
"type": "fill"
}
],
"interval": "",
"intervalFactor": 2,
"legendFormat": "Total RAM",
"orderByTime": "ASC",
"policy": "default",
"refId": "A",
"resultFormat": "time_series",
"select": [
[
{
"params": [
"value"
],
"type": "field"
},
{
"params": [],
"type": "mean"
}
]
],
"step": 60,
"tags": []
}
],
"title": "Total RAM",
"type": "stat"
},
{
"datasource": {
"type": "prometheus",
"uid": "${DS_PROMETHEUS}"
},
"fieldConfig": {
"defaults": {
"color": {
"mode": "thresholds"
},
"mappings": [
{
"options": {
"match": "null",
"result": {
"text": "N/A"
}
},
"type": "special"
}
],
"thresholds": {
"mode": "absolute",
"steps": [
{
"color": "green",
"value": null
},
{
"color": "red",
"value": 80
}
]
},
"unit": "decbytes"
},
"overrides": []
},
"gridPos": {
"h": 3,
"w": 4,
"x": 16,
"y": 6
},
"id": 54,
"maxDataPoints": 100,
"options": {
"colorMode": "none",
"graphMode": "none",
"justifyMode": "auto",
"orientation": "horizontal",
"percentChangeColorMode": "standard",
"reduceOptions": {
"calcs": [
"mean"
],
"fields": "",
"values": false
},
"showPercentChange": false,
"text": {},
"textMode": "auto",
"wideLayout": true
},
"pluginVersion": "11.4.0",
"targets": [
{
"datasource": {
"type": "prometheus",
"uid": "${DS_PROMETHEUS}"
},
"dsType": "influxdb",
"exemplar": true,
"expr": "java_lang_OperatingSystem_TotalSwapSpaceSize{job=\"$job\", instance=\"$app$node\"}",
"format": "time_series",
"groupBy": [
{
"params": [
"$__interval"
],
"type": "time"
},
{
"params": [
"null"
],
"type": "fill"
}
],
"interval": "",
"intervalFactor": 2,
"legendFormat": "Total SWAP",
"orderByTime": "ASC",
"policy": "default",
"refId": "A",
"resultFormat": "time_series",
"select": [
[
{
"params": [
"value"
],
"type": "field"
},
{
"params": [],
"type": "mean"
}
]
],
"step": 60,
"tags": []
}
],
"title": "Total SWAP",
"type": "stat"
},
{
"datasource": {
"type": "prometheus",
"uid": "${DS_PROMETHEUS}"
},
"description": "",
"fieldConfig": {
"defaults": {
"color": {
"fixedColor": "rgb(31, 120, 193)",
"mode": "fixed"
},
"mappings": [
{
"options": {
"match": "null",
"result": {
"text": "N/A"
}
},
"type": "special"
}
],
"thresholds": {
"mode": "absolute",
"steps": [
{
"color": "green",
"value": null
},
{
"color": "red",
"value": 80
}
]
},
"unit": "none"
},
"overrides": []
},
"gridPos": {
"h": 3,
"w": 4,
"x": 20,
"y": 6
},
"id": 16,
"maxDataPoints": 100,
"options": {
"colorMode": "none",
"graphMode": "none",
"justifyMode": "auto",
"orientation": "horizontal",
"percentChangeColorMode": "standard",
"reduceOptions": {
"calcs": [
"lastNotNull"
],
"fields": "",
"values": false
},
"showPercentChange": false,
"text": {},
"textMode": "auto",
"wideLayout": true
},
"pluginVersion": "11.4.0",
"targets": [
{
"datasource": {
"type": "prometheus",
"uid": "${DS_PROMETHEUS}"
},
"exemplar": true,
"expr": "java_lang_OperatingSystem_OpenFileDescriptorCount{job=\"$job\", instance=\"$app$node\"}",
"format": "time_series",
"instant": false,
"interval": "",
"intervalFactor": 1,
"legendFormat": "Open FDs",
"refId": "A"
}
],
"title": "Open file descriptors",
"type": "stat"
},
{
"datasource": {
"type": "prometheus",
"uid": "${DS_PROMETHEUS}"
},
"fieldConfig": {
"defaults": {
"color": {
"fixedColor": "text",
"mode": "fixed"
},
"mappings": [],
"thresholds": {
"mode": "absolute",
"steps": [
{
"color": "green",
"value": null
}
]
},
"unit": "ns"
},
"overrides": [
{
"matcher": {
"id": "byName",
"options": "Total Spent"
},
"properties": [
{
"id": "unit",
"value": "s"
}
]
}
]
},
"gridPos": {
"h": 4,
"w": 6,
"x": 0,
"y": 9
},
"id": 141,
"options": {
"colorMode": "value",
"graphMode": "none",
"justifyMode": "auto",
"orientation": "horizontal",
"percentChangeColorMode": "standard",
"reduceOptions": {
"calcs": [
"lastNotNull"
],
"fields": "",
"values": false
},
"showPercentChange": false,
"text": {
"titleSize": 20,
"valueSize": 20
},
"textMode": "value_and_name",
"wideLayout": true
},
"pluginVersion": "11.4.0",
"targets": [
{
"datasource": {
"type": "prometheus",
"uid": "${DS_PROMETHEUS}"
},
"exemplar": true,
"expr": "java_lang_OperatingSystem_ProcessCpuTime{job=\"$job\", instance=\"$app$node\"}",
"interval": "",
"legendFormat": "Process",
"refId": "A"
},
{
"datasource": {
"type": "prometheus",
"uid": "${DS_PROMETHEUS}"
},
"exemplar": true,
"expr": "java_lang_Threading_CurrentThreadCpuTime{job=\"$job\", instance=\"$app$node\"}",
"hide": false,
"interval": "",
"legendFormat": "Current Thread",
"refId": "B"
},
{
"datasource": {
"type": "prometheus",
"uid": "${DS_PROMETHEUS}"
},
"exemplar": true,
"expr": "process_cpu_seconds_total{job=\"$job\", instance=\"$app$node\"}",
"hide": false,
"interval": "",
"legendFormat": "Total Spent",
"refId": "C"
}
],
"title": "Cpu Time",
"type": "stat"
},
{
"datasource": {
"type": "prometheus",
"uid": "${DS_PROMETHEUS}"
},
"description": "",
"fieldConfig": {
"defaults": {
"color": {
"mode": "thresholds"
},
"mappings": [
{
"options": {
"match": "null",
"result": {
"text": "N/A"
}
},
"type": "special"
}
],
"max": 100,
"min": 0,
"thresholds": {
"mode": "absolute",
"steps": [
{
"color": "green",
"value": null
},
{
"color": "#EAB839",
"value": 40
},
{
"color": "red",
"value": 80
}
]
},
"unit": "percent"
},
"overrides": []
},
"gridPos": {
"h": 4,
"w": 4,
"x": 6,
"y": 9
},
"id": 14,
"maxDataPoints": 100,
"options": {
"minVizHeight": 75,
"minVizWidth": 75,
"orientation": "horizontal",
"reduceOptions": {
"calcs": [
"mean"
],
"fields": "",
"values": false
},
"showThresholdLabels": false,
"showThresholdMarkers": true,
"sizing": "auto",
"text": {}
},
"pluginVersion": "11.4.0",
"targets": [
{
"datasource": {
"type": "prometheus",
"uid": "${DS_PROMETHEUS}"
},
"exemplar": true,
"expr": "java_lang_OperatingSystem_SystemCpuLoad{job=\"$job\", instance=\"$app$node\"} * 100",
"format": "time_series",
"instant": false,
"interval": "",
"intervalFactor": 1,
"legendFormat": "CPU System load average",
"refId": "A"
}
],
"title": "CPU System load average",
"type": "gauge"
},
{
"datasource": {
"type": "prometheus",
"uid": "${DS_PROMETHEUS}"
},
"description": "",
"fieldConfig": {
"defaults": {
"color": {
"mode": "thresholds"
},
"mappings": [
{
"options": {
"match": "null",
"result": {
"text": "N/A"
}
},
"type": "special"
}
],
"max": 100,
"min": 0,
"thresholds": {
"mode": "absolute",
"steps": [
{
"color": "green",
"value": null
},
{
"color": "#EAB839",
"value": 40
},
{
"color": "red",
"value": 80
}
]
},
"unit": "percent"
},
"overrides": []
},
"gridPos": {
"h": 4,
"w": 4,
"x": 10,
"y": 9
},
"id": 10,
"maxDataPoints": 100,
"options": {
"minVizHeight": 75,
"minVizWidth": 75,
"orientation": "horizontal",
"reduceOptions": {
"calcs": [
"lastNotNull"
],
"fields": "",
"values": false
},
"showThresholdLabels": false,
"showThresholdMarkers": true,
"sizing": "auto",
"text": {}
},
"pluginVersion": "11.4.0",
"targets": [
{
"datasource": {
"type": "prometheus",
"uid": "${DS_PROMETHEUS}"
},
"exemplar": true,
"expr": "avg_over_time(java_lang_OperatingSystem_ProcessCpuLoad{job=\"$job\", instance=\"$app$node\"}[1m]) * 100",
"format": "time_series",
"interval": "",
"intervalFactor": 1,
"legendFormat": "CPU Process Load (1m avg)",
"refId": "A"
}
],
"title": "CPU Process Load (1m avg)",
"type": "gauge"
},
{
"datasource": {
"type": "prometheus",
"uid": "${DS_PROMETHEUS}"
},
"fieldConfig": {
"defaults": {
"color": {
"mode": "thresholds"
},
"decimals": 2,
"mappings": [
{
"options": {
"match": "null",
"result": {
"text": "N/A"
}
},
"type": "special"
}
],
"max": 100,
"min": 0,
"thresholds": {
"mode": "absolute",
"steps": [
{
"color": "green",
"value": null
},
{
"color": "#EAB839",
"value": 40
},
{
"color": "red",
"value": 80
}
]
},
"unit": "percent"
},
"overrides": []
},
"gridPos": {
"h": 4,
"w": 4,
"x": 14,
"y": 9
},
"id": 58,
"maxDataPoints": 100,
"options": {
"minVizHeight": 75,
"minVizWidth": 75,
"orientation": "horizontal",
"reduceOptions": {
"calcs": [
"lastNotNull"
],
"fields": "",
"values": false
},
"showThresholdLabels": false,
"showThresholdMarkers": true,
"sizing": "auto",
"text": {}
},
"pluginVersion": "11.4.0",
"targets": [
{
"datasource": {
"type": "prometheus",
"uid": "${DS_PROMETHEUS}"
},
"dsType": "influxdb",
"exemplar": true,
"expr": "avg_over_time(java_lang_OperatingSystem_SystemCpuLoad{job=\"$job\", instance=\"$app$node\"}[1m]) * 100",
"format": "time_series",
"groupBy": [
{
"params": [
"$__interval"
],
"type": "time"
},
{
"params": [
"null"
],
"type": "fill"
}
],
"interval": "",
"intervalFactor": 1,
"legendFormat": "CPU System Load (1m avg)",
"orderByTime": "ASC",
"policy": "default",
"refId": "A",
"resultFormat": "time_series",
"select": [
[
{
"params": [
"value"
],
"type": "field"
},
{
"params": [],
"type": "mean"
}
]
],
"step": 30,
"tags": []
}
],
"title": "CPU System Load (1m avg)",
"type": "gauge"
},
{
"datasource": {
"type": "prometheus",
"uid": "${DS_PROMETHEUS}"
},
"description": "",
"fieldConfig": {
"defaults": {
"color": {
"mode": "thresholds"
},
"decimals": 2,
"mappings": [
{
"options": {
"match": "null",
"result": {
"text": "N/A"
}
},
"type": "special"
}
],
"max": 100,
"min": 0,
"thresholds": {
"mode": "absolute",
"steps": [
{
"color": "green",
"value": null
},
{
"color": "#EAB839",
"value": 40
},
{
"color": "red",
"value": 80
}
]
},
"unit": "percent"
},
"overrides": []
},
"gridPos": {
"h": 4,
"w": 3,
"x": 18,
"y": 9
},
"id": 48,
"maxDataPoints": 100,
"options": {
"minVizHeight": 75,
"minVizWidth": 75,
"orientation": "horizontal",
"reduceOptions": {
"calcs": [
"mean"
],
"fields": "",
"values": false
},
"showThresholdLabels": false,
"showThresholdMarkers": true,
"sizing": "auto",
"text": {}
},
"pluginVersion": "11.4.0",
"targets": [
{
"datasource": {
"type": "prometheus",
"uid": "${DS_PROMETHEUS}"
},
"dsType": "influxdb",
"exemplar": true,
"expr": "100 - (100 * java_lang_OperatingSystem_FreePhysicalMemorySize{job=\"$job\", instance=\"$app$node\"} / on(instance) java_lang_OperatingSystem_TotalPhysicalMemorySize{job=\"$job\", instance=\"$app$node\"})",
"format": "time_series",
"groupBy": [
{
"params": [
"$__interval"
],
"type": "time"
},
{
"params": [
"null"
],
"type": "fill"
}
],
"instant": true,
"interval": "",
"intervalFactor": 2,
"legendFormat": "Memory Utilization",
"orderByTime": "ASC",
"policy": "default",
"refId": "A",
"resultFormat": "time_series",
"select": [
[
{
"params": [
"value"
],
"type": "field"
},
{
"params": [],
"type": "mean"
}
]
],
"step": 60,
"tags": []
}
],
"title": "Memory Utilization",
"type": "gauge"
},
{
"datasource": {
"type": "prometheus",
"uid": "${DS_PROMETHEUS}"
},
"fieldConfig": {
"defaults": {
"color": {
"mode": "thresholds"
},
"mappings": [
{
"options": {
"match": "null",
"result": {
"text": "N/A"
}
},
"type": "special"
}
],
"max": 100,
"min": 0,
"thresholds": {
"mode": "absolute",
"steps": [
{
"color": "green",
"value": null
},
{
"color": "#EAB839",
"value": 40
},
{
"color": "red",
"value": 80
}
]
},
"unit": "percent"
},
"overrides": []
},
"gridPos": {
"h": 4,
"w": 3,
"x": 21,
"y": 9
},
"id": 52,
"maxDataPoints": 100,
"options": {
"minVizHeight": 75,
"minVizWidth": 75,
"orientation": "horizontal",
"reduceOptions": {
"calcs": [
"mean"
],
"fields": "",
"values": false
},
"showThresholdLabels": false,
"showThresholdMarkers": true,
"sizing": "auto",
"text": {}
},
"pluginVersion": "11.4.0",
"targets": [
{
"datasource": {
"type": "prometheus",
"uid": "${DS_PROMETHEUS}"
},
"dsType": "influxdb",
"exemplar": true,
"expr": "100 - (java_lang_OperatingSystem_FreeSwapSpaceSize{job=\"$job\", instance=\"$app$node\"} / on(instance) java_lang_OperatingSystem_TotalSwapSpaceSize{job=\"$job\", instance=\"$app$node\"} * 100)",
"format": "time_series",
"groupBy": [
{
"params": [
"$__interval"
],
"type": "time"
},
{
"params": [
"null"
],
"type": "fill"
}
],
"interval": "",
"intervalFactor": 2,
"legendFormat": "SWAP Utilization",
"orderByTime": "ASC",
"policy": "default",
"refId": "A",
"resultFormat": "time_series",
"select": [
[
{
"params": [
"value"
],
"type": "field"
},
{
"params": [],
"type": "mean"
}
]
],
"step": 60,
"tags": []
}
],
"title": "SWAP Utilization",
"type": "gauge"
},
{
"datasource": {
"type": "prometheus",
"uid": "${DS_PROMETHEUS}"
},
"fieldConfig": {
"defaults": {
"color": {
"mode": "palette-classic"
},
"custom": {
"axisBorderShow": false,
"axisCenteredZero": false,
"axisColorMode": "text",
"axisLabel": "",
"axisPlacement": "auto",
"barAlignment": 0,
"barWidthFactor": 0.6,
"drawStyle": "line",
"fillOpacity": 10,
"gradientMode": "none",
"hideFrom": {
"legend": false,
"tooltip": false,
"viz": false
},
"insertNulls": false,
"lineInterpolation": "linear",
"lineWidth": 1,
"pointSize": 5,
"scaleDistribution": {
"type": "linear"
},
"showPoints": "never",
"spanNulls": true,
"stacking": {
"group": "A",
"mode": "normal"
},
"thresholdsStyle": {
"mode": "off"
}
},
"mappings": [],
"min": 0,
"thresholds": {
"mode": "absolute",
"steps": [
{
"color": "green",
"value": null
},
{
"color": "red",
"value": 80
}
]
},
"unit": "percentunit"
},
"overrides": []
},
"gridPos": {
"h": 9,
"w": 14,
"x": 0,
"y": 13
},
"id": 60,
"options": {
"legend": {
"calcs": [
"lastNotNull",
"max",
"mean"
],
"displayMode": "table",
"placement": "bottom",
"showLegend": true
},
"tooltip": {
"mode": "multi",
"sort": "none"
}
},
"pluginVersion": "11.4.0",
"targets": [
{
"datasource": {
"type": "prometheus",
"uid": "${DS_PROMETHEUS}"
},
"exemplar": true,
"expr": "java_lang_OperatingSystem_SystemCpuLoad{job=\"$job\", instance=\"$app$node\"}",
"format": "time_series",
"interval": "",
"intervalFactor": 2,
"legendFormat": "System",
"refId": "B",
"step": 20
},
{
"datasource": {
"type": "prometheus",
"uid": "${DS_PROMETHEUS}"
},
"dsType": "influxdb",
"exemplar": true,
"expr": "java_lang_OperatingSystem_ProcessCpuLoad{job=\"$job\", instance=\"$app$node\"}",
"format": "time_series",
"groupBy": [
{
"params": [
"$__interval"
],
"type": "time"
},
{
"params": [
"null"
],
"type": "fill"
}
],
"interval": "",
"intervalFactor": 2,
"legendFormat": "Process",
"orderByTime": "ASC",
"policy": "default",
"refId": "A",
"resultFormat": "time_series",
"select": [
[
{
"params": [
"value"
],
"type": "field"
},
{
"params": [],
"type": "mean"
}
]
],
"step": 20,
"tags": []
}
],
"title": "CPU load",
"type": "timeseries"
},
{
"datasource": {
"type": "prometheus",
"uid": "${DS_PROMETHEUS}"
},
"fieldConfig": {
"defaults": {
"color": {
"mode": "palette-classic"
},
"custom": {
"axisBorderShow": false,
"axisCenteredZero": false,
"axisColorMode": "text",
"axisLabel": "",
"axisPlacement": "auto",
"barAlignment": 0,
"barWidthFactor": 0.6,
"drawStyle": "line",
"fillOpacity": 10,
"gradientMode": "none",
"hideFrom": {
"legend": false,
"tooltip": false,
"viz": false
},
"insertNulls": false,
"lineInterpolation": "linear",
"lineStyle": {
"fill": "solid"
},
"lineWidth": 1,
"pointSize": 5,
"scaleDistribution": {
"type": "linear"
},
"showPoints": "never",
"spanNulls": false,
"stacking": {
"group": "A",
"mode": "none"
},
"thresholdsStyle": {
"mode": "off"
}
},
"decimals": 0,
"mappings": [],
"thresholds": {
"mode": "absolute",
"steps": [
{
"color": "green",
"value": null
}
]
},
"unit": "short"
},
"overrides": []
},
"gridPos": {
"h": 9,
"w": 10,
"x": 14,
"y": 13
},
"id": 76,
"options": {
"legend": {
"calcs": [
"min",
"lastNotNull",
"max",
"mean"
],
"displayMode": "table",
"placement": "bottom",
"showLegend": true
},
"tooltip": {
"mode": "multi",
"sort": "none"
}
},
"pluginVersion": "11.4.0",
"targets": [
{
"datasource": {
"type": "prometheus",
"uid": "${DS_PROMETHEUS}"
},
"exemplar": true,
"expr": "process_open_fds{job=\"$job\", instance=\"$app$node\"}",
"interval": "",
"legendFormat": "Descriptors",
"refId": "A"
}
],
"title": "Open File Descriptors",
"type": "timeseries"
},
{
"collapsed": false,
"gridPos": {
"h": 1,
"w": 24,
"x": 0,
"y": 22
},
"id": 110,
"panels": [],
"title": "Memory",
"type": "row"
},
{
"datasource": {
"type": "prometheus",
"uid": "${DS_PROMETHEUS}"
},
"fieldConfig": {
"defaults": {
"color": {
"mode": "palette-classic"
},
"custom": {
"axisBorderShow": false,
"axisCenteredZero": false,
"axisColorMode": "text",
"axisLabel": "",
"axisPlacement": "auto",
"barAlignment": 0,
"barWidthFactor": 0.6,
"drawStyle": "line",
"fillOpacity": 10,
"gradientMode": "none",
"hideFrom": {
"legend": false,
"tooltip": false,
"viz": false
},
"insertNulls": false,
"lineInterpolation": "linear",
"lineWidth": 1,
"pointSize": 5,
"scaleDistribution": {
"type": "linear"
},
"showPoints": "never",
"spanNulls": true,
"stacking": {
"group": "A",
"mode": "none"
},
"thresholdsStyle": {
"mode": "off"
}
},
"mappings": [],
"thresholds": {
"mode": "absolute",
"steps": [
{
"color": "green",
"value": null
},
{
"color": "red",
"value": 80
}
]
},
"unit": "decbytes"
},
"overrides": []
},
"gridPos": {
"h": 10,
"w": 12,
"x": 0,
"y": 23
},
"id": 74,
"options": {
"legend": {
"calcs": [
"min",
"lastNotNull",
"max",
"mean"
],
"displayMode": "table",
"placement": "bottom",
"showLegend": true
},
"tooltip": {
"mode": "multi",
"sort": "none"
}
},
"pluginVersion": "11.4.0",
"targets": [
{
"datasource": {
"type": "prometheus",
"uid": "${DS_PROMETHEUS}"
},
"exemplar": true,
"expr": "java_lang_OperatingSystem_FreePhysicalMemorySize{job=\"$job\", instance=\"$app$node\"}",
"format": "time_series",
"interval": "",
"intervalFactor": 1,
"legendFormat": "Free",
"refId": "C"
},
{
"datasource": {
"type": "prometheus",
"uid": "${DS_PROMETHEUS}"
},
"exemplar": true,
"expr": "java_lang_OperatingSystem_TotalPhysicalMemorySize{job=\"$job\", instance=\"$app$node\"}",
"format": "time_series",
"interval": "",
"intervalFactor": 1,
"legendFormat": "Total",
"refId": "A"
},
{
"datasource": {
"type": "prometheus",
"uid": "${DS_PROMETHEUS}"
},
"exemplar": true,
"expr": "java_lang_OperatingSystem_CommittedVirtualMemorySize{job=\"$job\", instance=\"$app$node\"}",
"format": "time_series",
"interval": "",
"intervalFactor": 1,
"legendFormat": "Committed VM",
"refId": "B"
}
],
"title": "Physical memory",
"type": "timeseries"
},
{
"datasource": {
"type": "prometheus",
"uid": "${DS_PROMETHEUS}"
},
"description": "",
"fieldConfig": {
"defaults": {
"color": {
"mode": "palette-classic"
},
"custom": {
"axisBorderShow": false,
"axisCenteredZero": false,
"axisColorMode": "text",
"axisLabel": "",
"axisPlacement": "auto",
"barAlignment": 0,
"barWidthFactor": 0.6,
"drawStyle": "line",
"fillOpacity": 10,
"gradientMode": "none",
"hideFrom": {
"legend": false,
"tooltip": false,
"viz": false
},
"insertNulls": false,
"lineInterpolation": "linear",
"lineWidth": 1,
"pointSize": 5,
"scaleDistribution": {
"type": "linear"
},
"showPoints": "auto",
"spanNulls": false,
"stacking": {
"group": "A",
"mode": "none"
},
"thresholdsStyle": {
"mode": "off"
}
},
"mappings": [],
"thresholds": {
"mode": "absolute",
"steps": [
{
"color": "green",
"value": null
},
{
"color": "red",
"value": 80
}
]
},
"unit": "bytes"
},
"overrides": []
},
"gridPos": {
"h": 10,
"w": 12,
"x": 12,
"y": 23
},
"id": 151,
"options": {
"legend": {
"calcs": [
"min",
"lastNotNull",
"max",
"mean"
],
"displayMode": "table",
"placement": "bottom",
"showLegend": true
},
"tooltip": {
"mode": "single",
"sort": "none"
}
},
"pluginVersion": "11.4.0",
"targets": [
{
"datasource": {
"type": "prometheus",
"uid": "${DS_PROMETHEUS}"
},
"exemplar": true,
"expr": "process_resident_memory_bytes{job=\"$job\", instance=\"$app$node\"}",
"interval": "",
"legendFormat": "Resident",
"refId": "A"
},
{
"datasource": {
"type": "prometheus",
"uid": "${DS_PROMETHEUS}"
},
"exemplar": true,
"expr": "process_virtual_memory_bytes{job=\"$job\", instance=\"$app$node\"}",
"hide": false,
"interval": "",
"legendFormat": "Virtual",
"refId": "B"
}
],
"title": "Process Memory",
"type": "timeseries"
},
{
"collapsed": false,
"gridPos": {
"h": 1,
"w": 24,
"x": 0,
"y": 33
},
"id": 32,
"panels": [],
"title": "Memory JVM",
"type": "row"
},
{
"datasource": {
"type": "prometheus",
"uid": "${DS_PROMETHEUS}"
},
"description": "",
"fieldConfig": {
"defaults": {
"color": {
"mode": "palette-classic"
},
"custom": {
"axisBorderShow": false,
"axisCenteredZero": false,
"axisColorMode": "text",
"axisLabel": "",
"axisPlacement": "auto",
"barAlignment": 0,
"barWidthFactor": 0.6,
"drawStyle": "line",
"fillOpacity": 10,
"gradientMode": "none",
"hideFrom": {
"legend": false,
"tooltip": false,
"viz": false
},
"insertNulls": false,
"lineInterpolation": "linear",
"lineWidth": 1,
"pointSize": 5,
"scaleDistribution": {
"type": "linear"
},
"showPoints": "auto",
"spanNulls": false,
"stacking": {
"group": "A",
"mode": "none"
},
"thresholdsStyle": {
"mode": "off"
}
},
"mappings": [],
"thresholds": {
"mode": "absolute",
"steps": [
{
"color": "green",
"value": null
},
{
"color": "red",
"value": 80
}
]
},
"unit": "bytes"
},
"overrides": []
},
"gridPos": {
"h": 9,
"w": 24,
"x": 0,
"y": 34
},
"id": 80,
"options": {
"legend": {
"calcs": [
"min",
"lastNotNull",
"max",
"mean"
],
"displayMode": "table",
"placement": "bottom",
"showLegend": true
},
"tooltip": {
"mode": "multi",
"sort": "none"
}
},
"pluginVersion": "11.4.0",
"repeat": "memarea",
"repeatDirection": "h",
"targets": [
{
"datasource": {
"type": "prometheus",
"uid": "${DS_PROMETHEUS}"
},
"editorMode": "code",
"exemplar": true,
"expr": "jvm_memory_used_bytes{area=~\"$memarea\",job=\"$job\", instance=\"$app$node\"}",
"interval": "",
"legendFormat": "Used",
"range": true,
"refId": "A"
},
{
"datasource": {
"type": "prometheus",
"uid": "${DS_PROMETHEUS}"
},
"editorMode": "code",
"exemplar": true,
"expr": "jvm_memory_max_bytes{area=~\"$memarea\",job=\"$job\",instance=\"$app$node\"}",
"hide": false,
"interval": "",
"legendFormat": "Max",
"range": true,
"refId": "B"
}
],
"title": "JVM Memory Used [$memarea]",
"type": "timeseries"
},
{
"datasource": {
"type": "prometheus",
"uid": "${DS_PROMETHEUS}"
},
"fieldConfig": {
"defaults": {
"color": {
"mode": "palette-classic"
},
"custom": {
"axisBorderShow": false,
"axisCenteredZero": false,
"axisColorMode": "text",
"axisLabel": "",
"axisPlacement": "auto",
"barAlignment": 0,
"barWidthFactor": 0.6,
"drawStyle": "line",
"fillOpacity": 10,
"gradientMode": "none",
"hideFrom": {
"legend": false,
"tooltip": false,
"viz": false
},
"insertNulls": false,
"lineInterpolation": "linear",
"lineWidth": 1,
"pointSize": 5,
"scaleDistribution": {
"type": "linear"
},
"showPoints": "never",
"spanNulls": true,
"stacking": {
"group": "A",
"mode": "none"
},
"thresholdsStyle": {
"mode": "off"
}
},
"mappings": [],
"thresholds": {
"mode": "absolute",
"steps": [
{
"color": "green",
"value": null
},
{
"color": "red",
"value": 80
}
]
},
"unit": "percent"
},
"overrides": []
},
"gridPos": {
"h": 9,
"w": 24,
"x": 0,
"y": 43
},
"id": 82,
"options": {
"legend": {
"calcs": [
"min",
"lastNotNull",
"max",
"mean"
],
"displayMode": "table",
"placement": "bottom",
"showLegend": true
},
"tooltip": {
"mode": "multi",
"sort": "none"
}
},
"pluginVersion": "11.4.0",
"repeat": "memarea",
"repeatDirection": "h",
"targets": [
{
"datasource": {
"type": "prometheus",
"uid": "${DS_PROMETHEUS}"
},
"editorMode": "code",
"exemplar": true,
"expr": "jvm_memory_used_bytes{area=\"$memarea\",job=\"$job\", instance=\"$app$node\"} / ignoring(area) group_left java_lang_OperatingSystem_TotalPhysicalMemorySize{job=\"$job\", instance=\"$app$node\"} *100",
"format": "time_series",
"interval": "",
"intervalFactor": 5,
"legendFormat": "System",
"metric": "jvm_memory_bytes_used",
"range": true,
"refId": "A",
"step": 50
},
{
"datasource": {
"type": "prometheus",
"uid": "${DS_PROMETHEUS}"
},
"editorMode": "code",
"exemplar": true,
"expr": "jvm_memory_used_bytes{area=\"$memarea\",job=\"$job\", instance=\"$app$node\"} / (jvm_memory_max_bytes{area=\"$memarea\", job=\"$job\",instance=\"$app$node\"} >=0) *100",
"format": "time_series",
"hide": false,
"interval": "",
"intervalFactor": 5,
"legendFormat": "JVM",
"metric": "jvm_memory_bytes_used",
"range": true,
"refId": "B",
"step": 50
}
],
"title": "JVM Memory Usage [$memarea]",
"type": "timeseries"
},
{
"datasource": {
"type": "prometheus",
"uid": "${DS_PROMETHEUS}"
},
"fieldConfig": {
"defaults": {
"color": {
"mode": "palette-classic"
},
"custom": {
"axisBorderShow": false,
"axisCenteredZero": false,
"axisColorMode": "text",
"axisLabel": "",
"axisPlacement": "auto",
"barAlignment": 0,
"barWidthFactor": 0.6,
"drawStyle": "line",
"fillOpacity": 10,
"gradientMode": "none",
"hideFrom": {
"legend": false,
"tooltip": false,
"viz": false
},
"insertNulls": false,
"lineInterpolation": "linear",
"lineWidth": 1,
"pointSize": 1,
"scaleDistribution": {
"type": "linear"
},
"showPoints": "auto",
"spanNulls": false,
"stacking": {
"group": "A",
"mode": "none"
},
"thresholdsStyle": {
"mode": "off"
}
},
"mappings": [],
"thresholds": {
"mode": "absolute",
"steps": [
{
"color": "green",
"value": null
}
]
},
"unit": "bytes"
},
"overrides": []
},
"gridPos": {
"h": 9,
"w": 24,
"x": 0,
"y": 52
},
"id": 129,
"options": {
"legend": {
"calcs": [
"min",
"lastNotNull",
"max",
"mean"
],
"displayMode": "table",
"placement": "bottom",
"showLegend": true
},
"tooltip": {
"mode": "multi",
"sort": "none"
}
},
"pluginVersion": "11.4.0",
"targets": [
{
"datasource": {
"type": "prometheus",
"uid": "${DS_PROMETHEUS}"
},
"editorMode": "code",
"exemplar": true,
"expr": "jvm_memory_committed_bytes{job=\"$job\", instance=\"$app$node\"}",
"interval": "",
"legendFormat": "{{area}}",
"range": true,
"refId": "A"
}
],
"title": "JVM Memory committed",
"type": "timeseries"
},
{
"collapsed": false,
"gridPos": {
"h": 1,
"w": 24,
"x": 0,
"y": 61
},
"id": 86,
"panels": [],
"title": "Memory JVM Pool",
"type": "row"
},
{
"datasource": {
"type": "prometheus",
"uid": "${DS_PROMETHEUS}"
},
"fieldConfig": {
"defaults": {
"color": {
"mode": "palette-classic"
},
"custom": {
"axisBorderShow": false,
"axisCenteredZero": false,
"axisColorMode": "text",
"axisLabel": "",
"axisPlacement": "auto",
"barAlignment": 0,
"barWidthFactor": 0.6,
"drawStyle": "line",
"fillOpacity": 10,
"gradientMode": "none",
"hideFrom": {
"legend": false,
"tooltip": false,
"viz": false
},
"insertNulls": false,
"lineInterpolation": "linear",
"lineWidth": 1,
"pointSize": 5,
"scaleDistribution": {
"type": "linear"
},
"showPoints": "auto",
"spanNulls": false,
"stacking": {
"group": "A",
"mode": "none"
},
"thresholdsStyle": {
"mode": "off"
}
},
"mappings": [],
"thresholds": {
"mode": "absolute",
"steps": [
{
"color": "green",
"value": null
},
{
"color": "red",
"value": 80
}
]
},
"unit": "bytes"
},
"overrides": []
},
"gridPos": {
"h": 9,
"w": 24,
"x": 0,
"y": 62
},
"id": 90,
"maxPerRow": 2,
"options": {
"legend": {
"calcs": [
"min",
"lastNotNull",
"max",
"mean"
],
"displayMode": "table",
"placement": "bottom",
"showLegend": true
},
"tooltip": {
"mode": "multi",
"sort": "none"
}
},
"pluginVersion": "11.4.0",
"repeat": "mempool",
"repeatDirection": "h",
"targets": [
{
"datasource": {
"type": "prometheus",
"uid": "${DS_PROMETHEUS}"
},
"editorMode": "code",
"exemplar": true,
"expr": "jvm_memory_pool_max_bytes{pool=~\"$mempool\",job=\"$job\",instance=\"$app$node\"}",
"interval": "",
"legendFormat": "Max",
"range": true,
"refId": "A"
},
{
"datasource": {
"type": "prometheus",
"uid": "${DS_PROMETHEUS}"
},
"editorMode": "code",
"exemplar": true,
"expr": "jvm_memory_pool_used_bytes{pool=~\"$mempool\",job=\"$job\",instance=\"$app$node\"}",
"hide": false,
"interval": "",
"legendFormat": "Used",
"range": true,
"refId": "B"
},
{
"datasource": {
"type": "prometheus",
"uid": "${DS_PROMETHEUS}"
},
"editorMode": "code",
"exemplar": true,
"expr": "jvm_memory_pool_committed_bytes{pool=~\"$mempool\",job=\"$job\",instance=\"$app$node\"}",
"hide": false,
"interval": "",
"legendFormat": "Committed",
"range": true,
"refId": "C"
},
{
"datasource": {
"type": "prometheus",
"uid": "${DS_PROMETHEUS}"
},
"editorMode": "code",
"exemplar": true,
"expr": "rate(jvm_memory_pool_committed_bytes{pool=~\"$mempool\",job=\"$job\",instance=\"$app$node\"}[$__rate_interval])",
"format": "time_series",
"hide": false,
"instant": false,
"interval": "60s",
"legendFormat": "Committed Rate",
"range": true,
"refId": "D"
}
],
"title": "Memory pool [$mempool]",
"type": "timeseries"
},
{
"collapsed": false,
"gridPos": {
"h": 1,
"w": 24,
"x": 0,
"y": 89
},
"id": 20,
"panels": [],
"title": "Garbage Collector",
"type": "row"
},
{
"datasource": {
"type": "prometheus",
"uid": "${DS_PROMETHEUS}"
},
"description": "",
"fieldConfig": {
"defaults": {
"color": {
"mode": "palette-classic"
},
"custom": {
"axisBorderShow": false,
"axisCenteredZero": false,
"axisColorMode": "text",
"axisLabel": "",
"axisPlacement": "auto",
"barAlignment": 0,
"barWidthFactor": 0.6,
"drawStyle": "line",
"fillOpacity": 10,
"gradientMode": "none",
"hideFrom": {
"legend": false,
"tooltip": false,
"viz": false
},
"insertNulls": false,
"lineInterpolation": "linear",
"lineWidth": 1,
"pointSize": 5,
"scaleDistribution": {
"type": "linear"
},
"showPoints": "never",
"spanNulls": true,
"stacking": {
"group": "A",
"mode": "none"
},
"thresholdsStyle": {
"mode": "off"
}
},
"decimals": 0,
"mappings": [],
"thresholds": {
"mode": "absolute",
"steps": [
{
"color": "green",
"value": null
},
{
"color": "red",
"value": 80
}
]
},
"unit": "short"
},
"overrides": []
},
"gridPos": {
"h": 8,
"w": 12,
"x": 0,
"y": 90
},
"id": 22,
"options": {
"legend": {
"calcs": [
"min",
"lastNotNull",
"max"
],
"displayMode": "table",
"placement": "bottom",
"showLegend": true
},
"tooltip": {
"mode": "multi",
"sort": "none"
}
},
"pluginVersion": "11.4.0",
"targets": [
{
"datasource": {
"type": "prometheus",
"uid": "${DS_PROMETHEUS}"
},
"exemplar": true,
"expr": "increase(jvm_gc_collection_seconds_count{job=\"$job\", instance=\"$app$node\"}[$__interval])",
"format": "time_series",
"interval": "60s",
"intervalFactor": 1,
"legendFormat": "{{gc}}",
"refId": "A"
}
],
"title": "GC count increase",
"type": "timeseries"
},
{
"datasource": {
"type": "prometheus",
"uid": "${DS_PROMETHEUS}"
},
"description": "",
"fieldConfig": {
"defaults": {
"color": {
"mode": "palette-classic"
},
"custom": {
"axisBorderShow": false,
"axisCenteredZero": false,
"axisColorMode": "text",
"axisLabel": "",
"axisPlacement": "auto",
"barAlignment": 0,
"barWidthFactor": 0.6,
"drawStyle": "line",
"fillOpacity": 10,
"gradientMode": "none",
"hideFrom": {
"legend": false,
"tooltip": false,
"viz": false
},
"insertNulls": false,
"lineInterpolation": "linear",
"lineWidth": 1,
"pointSize": 5,
"scaleDistribution": {
"type": "linear"
},
"showPoints": "never",
"spanNulls": true,
"stacking": {
"group": "A",
"mode": "none"
},
"thresholdsStyle": {
"mode": "off"
}
},
"mappings": [],
"thresholds": {
"mode": "absolute",
"steps": [
{
"color": "green",
"value": null
},
{
"color": "red",
"value": 80
}
]
},
"unit": "short"
},
"overrides": []
},
"gridPos": {
"h": 8,
"w": 12,
"x": 12,
"y": 90
},
"id": 161,
"options": {
"legend": {
"calcs": [
"min",
"lastNotNull",
"max"
],
"displayMode": "table",
"placement": "bottom",
"showLegend": true
},
"tooltip": {
"mode": "multi",
"sort": "none"
}
},
"pluginVersion": "11.4.0",
"targets": [
{
"datasource": {
"type": "prometheus",
"uid": "${DS_PROMETHEUS}"
},
"editorMode": "code",
"exemplar": true,
"expr": "rate(jvm_gc_collection_seconds_count{job=\"$job\", instance=\"$app$node\"}[$__rate_interval])",
"format": "time_series",
"interval": "60s",
"intervalFactor": 1,
"legendFormat": "{{gc}}",
"range": true,
"refId": "A"
}
],
"title": "GC count rate",
"type": "timeseries"
},
{
"datasource": {
"type": "prometheus",
"uid": "${DS_PROMETHEUS}"
},
"description": "",
"fieldConfig": {
"defaults": {
"color": {
"mode": "palette-classic"
},
"custom": {
"axisBorderShow": false,
"axisCenteredZero": false,
"axisColorMode": "text",
"axisLabel": "",
"axisPlacement": "auto",
"barAlignment": 0,
"barWidthFactor": 0.6,
"drawStyle": "line",
"fillOpacity": 10,
"gradientMode": "none",
"hideFrom": {
"legend": false,
"tooltip": false,
"viz": false
},
"insertNulls": false,
"lineInterpolation": "linear",
"lineWidth": 1,
"pointSize": 5,
"scaleDistribution": {
"type": "linear"
},
"showPoints": "never",
"spanNulls": true,
"stacking": {
"group": "A",
"mode": "none"
},
"thresholdsStyle": {
"mode": "off"
}
},
"decimals": 0,
"mappings": [],
"thresholds": {
"mode": "absolute",
"steps": [
{
"color": "green"
},
{
"color": "red",
"value": 80
}
]
},
"unit": "s"
},
"overrides": []
},
"gridPos": {
"h": 8,
"w": 12,
"x": 0,
"y": 98
},
"id": 66,
"options": {
"legend": {
"calcs": [
"min",
"lastNotNull",
"max"
],
"displayMode": "table",
"placement": "bottom",
"showLegend": true
},
"tooltip": {
"mode": "multi",
"sort": "none"
}
},
"pluginVersion": "11.4.0",
"targets": [
{
"datasource": {
"type": "prometheus",
"uid": "${DS_PROMETHEUS}"
},
"exemplar": true,
"expr": "increase(jvm_gc_collection_seconds_sum{job=\"$job\", instance=\"$app$node\"}[$__interval])",
"format": "time_series",
"interval": "60s",
"intervalFactor": 5,
"legendFormat": "{{gc}}",
"metric": "",
"refId": "A",
"step": 25
}
],
"title": "GC Time increase",
"type": "timeseries"
},
{
"datasource": {
"type": "prometheus",
"uid": "${DS_PROMETHEUS}"
},
"description": "",
"fieldConfig": {
"defaults": {
"color": {
"mode": "palette-classic"
},
"custom": {
"axisBorderShow": false,
"axisCenteredZero": false,
"axisColorMode": "text",
"axisLabel": "",
"axisPlacement": "auto",
"barAlignment": 0,
"barWidthFactor": 0.6,
"drawStyle": "line",
"fillOpacity": 10,
"gradientMode": "none",
"hideFrom": {
"legend": false,
"tooltip": false,
"viz": false
},
"insertNulls": false,
"lineInterpolation": "linear",
"lineWidth": 1,
"pointSize": 5,
"scaleDistribution": {
"type": "linear"
},
"showPoints": "never",
"spanNulls": true,
"stacking": {
"group": "A",
"mode": "none"
},
"thresholdsStyle": {
"mode": "off"
}
},
"mappings": [],
"thresholds": {
"mode": "absolute",
"steps": [
{
"color": "green"
},
{
"color": "red",
"value": 80
}
]
},
"unit": "s"
},
"overrides": []
},
"gridPos": {
"h": 8,
"w": 12,
"x": 12,
"y": 98
},
"id": 24,
"options": {
"legend": {
"calcs": [
"min",
"lastNotNull",
"max"
],
"displayMode": "table",
"placement": "bottom",
"showLegend": true
},
"tooltip": {
"mode": "multi",
"sort": "none"
}
},
"pluginVersion": "11.4.0",
"targets": [
{
"datasource": {
"type": "prometheus",
"uid": "${DS_PROMETHEUS}"
},
"exemplar": true,
"expr": "rate(jvm_gc_collection_seconds_sum{job=\"$job\", instance=\"$app$node\"}[$__rate_interval])",
"format": "time_series",
"interval": "60s",
"intervalFactor": 1,
"legendFormat": "{{gc}}",
"refId": "A"
}
],
"title": "GC Time rate",
"type": "timeseries"
},
{
"collapsed": false,
"gridPos": {
"h": 1,
"w": 24,
"x": 0,
"y": 106
},
"id": 38,
"panels": [],
"title": "Threading",
"type": "row"
},
{
"datasource": {
"type": "prometheus",
"uid": "${DS_PROMETHEUS}"
},
"description": "",
"fieldConfig": {
"defaults": {
"color": {
"mode": "palette-classic"
},
"custom": {
"axisBorderShow": false,
"axisCenteredZero": false,
"axisColorMode": "text",
"axisLabel": "",
"axisPlacement": "auto",
"barAlignment": 0,
"barWidthFactor": 0.6,
"drawStyle": "line",
"fillOpacity": 10,
"gradientMode": "none",
"hideFrom": {
"legend": false,
"tooltip": false,
"viz": false
},
"insertNulls": false,
"lineInterpolation": "linear",
"lineWidth": 1,
"pointSize": 5,
"scaleDistribution": {
"type": "linear"
},
"showPoints": "never",
"spanNulls": true,
"stacking": {
"group": "A",
"mode": "none"
},
"thresholdsStyle": {
"mode": "off"
}
},
"mappings": [],
"thresholds": {
"mode": "absolute",
"steps": [
{
"color": "green"
}
]
},
"unit": "short"
},
"overrides": []
},
"gridPos": {
"h": 11,
"w": 12,
"x": 0,
"y": 107
},
"id": 40,
"options": {
"legend": {
"calcs": [
"min",
"lastNotNull",
"max",
"mean"
],
"displayMode": "table",
"placement": "bottom",
"showLegend": true
},
"tooltip": {
"mode": "multi",
"sort": "none"
}
},
"pluginVersion": "11.4.0",
"targets": [
{
"datasource": {
"type": "prometheus",
"uid": "${DS_PROMETHEUS}"
},
"exemplar": true,
"expr": "java_lang_Threading_ThreadCount{job=\"$job\", instance=\"$app$node\"}",
"format": "time_series",
"instant": false,
"interval": "",
"intervalFactor": 1,
"legendFormat": "Current",
"refId": "A"
},
{
"datasource": {
"type": "prometheus",
"uid": "${DS_PROMETHEUS}"
},
"exemplar": true,
"expr": "java_lang_Threading_DaemonThreadCount{job=\"$job\", instance=\"$app$node\"}",
"format": "time_series",
"interval": "",
"intervalFactor": 1,
"legendFormat": "Daemon",
"refId": "B"
},
{
"datasource": {
"type": "prometheus",
"uid": "${DS_PROMETHEUS}"
},
"exemplar": true,
"expr": "java_lang_Threading_PeakThreadCount{job=\"$job\", instance=\"$app$node\"}",
"format": "time_series",
"hide": false,
"interval": "",
"intervalFactor": 1,
"legendFormat": "Peak",
"refId": "C"
},
{
"datasource": {
"type": "prometheus",
"uid": "${DS_PROMETHEUS}"
},
"exemplar": true,
"expr": "java_lang_Threading_TotalStartedThreadCount{job=\"$job\", instance=\"$app$node\"}",
"format": "time_series",
"hide": false,
"interval": "",
"intervalFactor": 1,
"legendFormat": "Started",
"refId": "D"
}
],
"title": "JVM Threading Threads",
"type": "timeseries"
},
{
"datasource": {
"type": "prometheus",
"uid": "${DS_PROMETHEUS}"
},
"description": "",
"fieldConfig": {
"defaults": {
"color": {
"mode": "palette-classic"
},
"custom": {
"axisBorderShow": false,
"axisCenteredZero": false,
"axisColorMode": "text",
"axisLabel": "",
"axisPlacement": "auto",
"barAlignment": 0,
"barWidthFactor": 0.6,
"drawStyle": "line",
"fillOpacity": 10,
"gradientMode": "none",
"hideFrom": {
"legend": false,
"tooltip": false,
"viz": false
},
"insertNulls": false,
"lineInterpolation": "linear",
"lineWidth": 1,
"pointSize": 5,
"scaleDistribution": {
"type": "linear"
},
"showPoints": "auto",
"spanNulls": false,
"stacking": {
"group": "A",
"mode": "none"
},
"thresholdsStyle": {
"mode": "off"
}
},
"mappings": [],
"thresholds": {
"mode": "absolute",
"steps": [
{
"color": "green"
},
{
"color": "red",
"value": 80
}
]
}
},
"overrides": []
},
"gridPos": {
"h": 11,
"w": 12,
"x": 12,
"y": 107
},
"id": 114,
"options": {
"legend": {
"calcs": [
"min",
"lastNotNull",
"max",
"mean"
],
"displayMode": "table",
"placement": "bottom",
"showLegend": true
},
"tooltip": {
"mode": "multi",
"sort": "none"
}
},
"pluginVersion": "11.4.0",
"targets": [
{
"datasource": {
"type": "prometheus",
"uid": "${DS_PROMETHEUS}"
},
"exemplar": true,
"expr": "jvm_threads_current{job=\"$job\", instance=\"$app$node\"}",
"interval": "",
"legendFormat": "Current",
"refId": "A"
},
{
"datasource": {
"type": "prometheus",
"uid": "${DS_PROMETHEUS}"
},
"exemplar": true,
"expr": "jvm_threads_daemon{job=\"$job\", instance=\"$app$node\"}",
"hide": false,
"interval": "",
"legendFormat": "Daemon",
"refId": "B"
},
{
"datasource": {
"type": "prometheus",
"uid": "${DS_PROMETHEUS}"
},
"exemplar": true,
"expr": "jvm_threads_deadlocked{job=\"$job\", instance=\"$app$node\"}",
"hide": false,
"interval": "",
"legendFormat": "Deadlocked",
"refId": "C"
},
{
"datasource": {
"type": "prometheus",
"uid": "${DS_PROMETHEUS}"
},
"exemplar": true,
"expr": "jvm_threads_deadlocked_monitor{job=\"$job\", instance=\"$app$node\"}",
"hide": false,
"interval": "",
"legendFormat": "Deadlocked monitor",
"refId": "F"
},
{
"datasource": {
"type": "prometheus",
"uid": "${DS_PROMETHEUS}"
},
"exemplar": true,
"expr": "jvm_threads_peak{job=\"$job\", instance=\"$app$node\"}",
"hide": false,
"interval": "",
"legendFormat": "Peak",
"refId": "D"
},
{
"datasource": {
"type": "prometheus",
"uid": "${DS_PROMETHEUS}"
},
"exemplar": true,
"expr": "jvm_threads_started_total{job=\"$job\", instance=\"$app$node\"}",
"hide": false,
"interval": "",
"legendFormat": "Started Total",
"refId": "E"
}
],
"title": "JVM Threads current",
"type": "timeseries"
},
{
"datasource": {
"type": "prometheus",
"uid": "${DS_PROMETHEUS}"
},
"description": "",
"fieldConfig": {
"defaults": {
"color": {
"mode": "palette-classic"
},
"custom": {
"axisBorderShow": false,
"axisCenteredZero": false,
"axisColorMode": "text",
"axisLabel": "",
"axisPlacement": "auto",
"barAlignment": 0,
"barWidthFactor": 0.6,
"drawStyle": "line",
"fillOpacity": 10,
"gradientMode": "none",
"hideFrom": {
"legend": false,
"tooltip": false,
"viz": false
},
"insertNulls": false,
"lineInterpolation": "linear",
"lineWidth": 1,
"pointSize": 5,
"scaleDistribution": {
"type": "linear"
},
"showPoints": "never",
"spanNulls": true,
"stacking": {
"group": "A",
"mode": "none"
},
"thresholdsStyle": {
"mode": "off"
}
},
"mappings": [],
"thresholds": {
"mode": "absolute",
"steps": [
{
"color": "green"
}
]
},
"unit": "short"
},
"overrides": []
},
"gridPos": {
"h": 11,
"w": 12,
"x": 0,
"y": 118
},
"id": 115,
"options": {
"legend": {
"calcs": [
"lastNotNull",
"max",
"mean"
],
"displayMode": "table",
"placement": "bottom",
"showLegend": true
},
"tooltip": {
"mode": "multi",
"sort": "none"
}
},
"pluginVersion": "11.4.0",
"targets": [
{
"datasource": {
"type": "prometheus",
"uid": "${DS_PROMETHEUS}"
},
"exemplar": true,
"expr": "increase(java_lang_Threading_ThreadCount{job=\"$job\", instance=\"$app$node\"}[$__interval])",
"format": "time_series",
"instant": false,
"interval": "60s",
"intervalFactor": 1,
"legendFormat": "Current",
"refId": "A"
},
{
"datasource": {
"type": "prometheus",
"uid": "${DS_PROMETHEUS}"
},
"exemplar": true,
"expr": "increase(java_lang_Threading_DaemonThreadCount{job=\"$job\", instance=\"$app$node\"}[$__interval])",
"format": "time_series",
"interval": "60s",
"intervalFactor": 1,
"legendFormat": "Daemon",
"refId": "B"
},
{
"datasource": {
"type": "prometheus",
"uid": "${DS_PROMETHEUS}"
},
"exemplar": true,
"expr": "increase(java_lang_Threading_PeakThreadCount{job=\"$job\", instance=\"$app$node\"}[$__interval])",
"format": "time_series",
"hide": false,
"interval": "60s",
"intervalFactor": 1,
"legendFormat": "Peak",
"refId": "C"
},
{
"datasource": {
"type": "prometheus",
"uid": "${DS_PROMETHEUS}"
},
"exemplar": true,
"expr": "increase(java_lang_Threading_TotalStartedThreadCount{job=\"$job\", instance=\"$app$node\"}[$__interval])",
"format": "time_series",
"hide": false,
"interval": "60s",
"intervalFactor": 1,
"legendFormat": "Started",
"refId": "D"
}
],
"title": "JVM Threading Threads increase",
"type": "timeseries"
},
{
"datasource": {
"type": "prometheus",
"uid": "${DS_PROMETHEUS}"
},
"description": "",
"fieldConfig": {
"defaults": {
"color": {
"mode": "palette-classic"
},
"custom": {
"axisBorderShow": false,
"axisCenteredZero": false,
"axisColorMode": "text",
"axisLabel": "",
"axisPlacement": "auto",
"barAlignment": 0,
"barWidthFactor": 0.6,
"drawStyle": "line",
"fillOpacity": 10,
"gradientMode": "none",
"hideFrom": {
"legend": false,
"tooltip": false,
"viz": false
},
"insertNulls": false,
"lineInterpolation": "linear",
"lineWidth": 1,
"pointSize": 5,
"scaleDistribution": {
"type": "linear"
},
"showPoints": "auto",
"spanNulls": false,
"stacking": {
"group": "A",
"mode": "none"
},
"thresholdsStyle": {
"mode": "off"
}
},
"mappings": [],
"thresholds": {
"mode": "absolute",
"steps": [
{
"color": "green"
},
{
"color": "red",
"value": 80
}
]
}
},
"overrides": []
},
"gridPos": {
"h": 11,
"w": 12,
"x": 12,
"y": 118
},
"id": 116,
"options": {
"legend": {
"calcs": [
"lastNotNull",
"max",
"mean"
],
"displayMode": "table",
"placement": "bottom",
"showLegend": true
},
"tooltip": {
"mode": "multi",
"sort": "none"
}
},
"pluginVersion": "11.4.0",
"targets": [
{
"datasource": {
"type": "prometheus",
"uid": "${DS_PROMETHEUS}"
},
"exemplar": true,
"expr": "increase(jvm_threads_current{job=\"$job\", instance=\"$app$node\"}[$__interval])",
"interval": "60s",
"legendFormat": "Current",
"refId": "A"
},
{
"datasource": {
"type": "prometheus",
"uid": "${DS_PROMETHEUS}"
},
"exemplar": true,
"expr": "increase(jvm_threads_daemon{job=\"$job\", instance=\"$app$node\"}[$__interval])",
"hide": false,
"interval": "60s",
"legendFormat": "Daemon",
"refId": "B"
},
{
"datasource": {
"type": "prometheus",
"uid": "${DS_PROMETHEUS}"
},
"exemplar": true,
"expr": "increase(jvm_threads_deadlocked{job=\"$job\", instance=\"$app$node\"}[$__interval])",
"hide": false,
"interval": "60s",
"legendFormat": "Deadlocked",
"refId": "C"
},
{
"datasource": {
"type": "prometheus",
"uid": "${DS_PROMETHEUS}"
},
"exemplar": true,
"expr": "increase(jvm_threads_deadlocked_monitor{job=\"$job\", instance=\"$app$node\"}[$__interval])",
"hide": false,
"interval": "60s",
"legendFormat": "Deadlocked monitor",
"refId": "F"
},
{
"datasource": {
"type": "prometheus",
"uid": "${DS_PROMETHEUS}"
},
"exemplar": true,
"expr": "increase(jvm_threads_peak{job=\"$job\", instance=\"$app$node\"}[$__interval])",
"hide": false,
"interval": "60s",
"legendFormat": "Peak",
"refId": "D"
},
{
"datasource": {
"type": "prometheus",
"uid": "${DS_PROMETHEUS}"
},
"exemplar": true,
"expr": "increase(jvm_threads_started_total{job=\"$job\", instance=\"$app$node\"}[$__interval])",
"hide": false,
"interval": "60s",
"legendFormat": "Started Total",
"refId": "E"
}
],
"title": "JVM Threads current increase",
"type": "timeseries"
},
{
"datasource": {
"type": "prometheus",
"uid": "${DS_PROMETHEUS}"
},
"description": "",
"fieldConfig": {
"defaults": {
"color": {
"mode": "palette-classic"
},
"custom": {
"axisBorderShow": false,
"axisCenteredZero": false,
"axisColorMode": "text",
"axisLabel": "",
"axisPlacement": "auto",
"barAlignment": 0,
"barWidthFactor": 0.6,
"drawStyle": "line",
"fillOpacity": 10,
"gradientMode": "none",
"hideFrom": {
"legend": false,
"tooltip": false,
"viz": false
},
"insertNulls": false,
"lineInterpolation": "linear",
"lineWidth": 1,
"pointSize": 5,
"scaleDistribution": {
"type": "linear"
},
"showPoints": "never",
"spanNulls": true,
"stacking": {
"group": "A",
"mode": "none"
},
"thresholdsStyle": {
"mode": "off"
}
},
"mappings": [],
"thresholds": {
"mode": "absolute",
"steps": [
{
"color": "green"
}
]
},
"unit": "short"
},
"overrides": []
},
"gridPos": {
"h": 11,
"w": 12,
"x": 0,
"y": 129
},
"id": 171,
"options": {
"legend": {
"calcs": [
"lastNotNull",
"max",
"mean"
],
"displayMode": "table",
"placement": "bottom",
"showLegend": true
},
"tooltip": {
"mode": "multi",
"sort": "none"
}
},
"pluginVersion": "11.4.0",
"targets": [
{
"datasource": {
"type": "prometheus",
"uid": "${DS_PROMETHEUS}"
},
"exemplar": true,
"expr": "rate(java_lang_Threading_ThreadCount{job=\"$job\", instance=\"$app$node\"}[$__rate_interval])",
"format": "time_series",
"instant": false,
"interval": "60s",
"intervalFactor": 1,
"legendFormat": "Current",
"refId": "A"
},
{
"datasource": {
"type": "prometheus",
"uid": "${DS_PROMETHEUS}"
},
"exemplar": true,
"expr": "rate(java_lang_Threading_DaemonThreadCount{job=\"$job\", instance=\"$app$node\"}[$__rate_interval])",
"format": "time_series",
"interval": "60s",
"intervalFactor": 1,
"legendFormat": "Daemon",
"refId": "B"
},
{
"datasource": {
"type": "prometheus",
"uid": "${DS_PROMETHEUS}"
},
"exemplar": true,
"expr": "rate(java_lang_Threading_PeakThreadCount{job=\"$job\", instance=\"$app$node\"}[$__rate_interval])",
"format": "time_series",
"hide": false,
"interval": "60s",
"intervalFactor": 1,
"legendFormat": "Peak",
"refId": "C"
},
{
"datasource": {
"type": "prometheus",
"uid": "${DS_PROMETHEUS}"
},
"exemplar": true,
"expr": "rate(java_lang_Threading_TotalStartedThreadCount{job=\"$job\", instance=\"$app$node\"}[$__rate_interval])",
"format": "time_series",
"hide": false,
"interval": "60s",
"intervalFactor": 1,
"legendFormat": "Started",
"refId": "D"
}
],
"title": "JVM Threading Threads rate",
"type": "timeseries"
},
{
"datasource": {
"type": "prometheus",
"uid": "${DS_PROMETHEUS}"
},
"description": "",
"fieldConfig": {
"defaults": {
"color": {
"mode": "palette-classic"
},
"custom": {
"axisBorderShow": false,
"axisCenteredZero": false,
"axisColorMode": "text",
"axisLabel": "",
"axisPlacement": "auto",
"barAlignment": 0,
"barWidthFactor": 0.6,
"drawStyle": "line",
"fillOpacity": 10,
"gradientMode": "none",
"hideFrom": {
"legend": false,
"tooltip": false,
"viz": false
},
"insertNulls": false,
"lineInterpolation": "linear",
"lineWidth": 1,
"pointSize": 5,
"scaleDistribution": {
"type": "linear"
},
"showPoints": "auto",
"spanNulls": false,
"stacking": {
"group": "A",
"mode": "none"
},
"thresholdsStyle": {
"mode": "off"
}
},
"mappings": [],
"thresholds": {
"mode": "absolute",
"steps": [
{
"color": "green"
},
{
"color": "red",
"value": 80
}
]
}
},
"overrides": []
},
"gridPos": {
"h": 11,
"w": 12,
"x": 12,
"y": 129
},
"id": 172,
"options": {
"legend": {
"calcs": [
"lastNotNull",
"max",
"mean"
],
"displayMode": "table",
"placement": "bottom",
"showLegend": true
},
"tooltip": {
"mode": "multi",
"sort": "none"
}
},
"pluginVersion": "11.4.0",
"targets": [
{
"datasource": {
"type": "prometheus",
"uid": "${DS_PROMETHEUS}"
},
"exemplar": true,
"expr": "increase(jvm_threads_current{job=\"$job\", instance=\"$app$node\"}[$__rate_interval])",
"interval": "60s",
"legendFormat": "Current",
"refId": "A"
},
{
"datasource": {
"type": "prometheus",
"uid": "${DS_PROMETHEUS}"
},
"exemplar": true,
"expr": "rate(jvm_threads_daemon{job=\"$job\", instance=\"$app$node\"}[$__rate_interval])",
"hide": false,
"interval": "60s",
"legendFormat": "Daemon",
"refId": "B"
},
{
"datasource": {
"type": "prometheus",
"uid": "${DS_PROMETHEUS}"
},
"exemplar": true,
"expr": "rate(jvm_threads_deadlocked{job=\"$job\", instance=\"$app$node\"}[$__rate_interval])",
"hide": false,
"interval": "60s",
"legendFormat": "Deadlocked",
"refId": "C"
},
{
"datasource": {
"type": "prometheus",
"uid": "${DS_PROMETHEUS}"
},
"exemplar": true,
"expr": "rate(jvm_threads_deadlocked_monitor{job=\"$job\", instance=\"$app$node\"}[$__rate_interval])",
"hide": false,
"interval": "60s",
"legendFormat": "Deadlocked monitor",
"refId": "F"
},
{
"datasource": {
"type": "prometheus",
"uid": "${DS_PROMETHEUS}"
},
"exemplar": true,
"expr": "rate(jvm_threads_peak{job=\"$job\", instance=\"$app$node\"}[$__rate_interval])",
"hide": false,
"interval": "60s",
"legendFormat": "Peak",
"refId": "D"
},
{
"datasource": {
"type": "prometheus",
"uid": "${DS_PROMETHEUS}"
},
"exemplar": true,
"expr": "rate(jvm_threads_started_total{job=\"$job\", instance=\"$app$node\"}[$__rate_interval])",
"hide": false,
"interval": "60s",
"legendFormat": "Started Total",
"refId": "E"
}
],
"title": "JVM Threads current rate",
"type": "timeseries"
},
{
"collapsed": false,
"gridPos": {
"h": 1,
"w": 24,
"x": 0,
"y": 140
},
"id": 42,
"panels": [],
"title": "Classes",
"type": "row"
},
{
"datasource": {
"type": "prometheus",
"uid": "${DS_PROMETHEUS}"
},
"description": "",
"fieldConfig": {
"defaults": {
"color": {
"mode": "palette-classic"
},
"custom": {
"axisBorderShow": false,
"axisCenteredZero": false,
"axisColorMode": "text",
"axisLabel": "",
"axisPlacement": "auto",
"barAlignment": 0,
"barWidthFactor": 0.6,
"drawStyle": "line",
"fillOpacity": 10,
"gradientMode": "none",
"hideFrom": {
"legend": false,
"tooltip": false,
"viz": false
},
"insertNulls": false,
"lineInterpolation": "linear",
"lineWidth": 1,
"pointSize": 5,
"scaleDistribution": {
"type": "linear"
},
"showPoints": "never",
"spanNulls": true,
"stacking": {
"group": "A",
"mode": "none"
},
"thresholdsStyle": {
"mode": "off"
}
},
"mappings": [],
"thresholds": {
"mode": "absolute",
"steps": [
{
"color": "green"
},
{
"color": "red",
"value": 80
}
]
},
"unit": "short"
},
"overrides": []
},
"gridPos": {
"h": 8,
"w": 12,
"x": 0,
"y": 141
},
"id": 44,
"options": {
"legend": {
"calcs": [
"min",
"lastNotNull",
"max",
"mean"
],
"displayMode": "table",
"placement": "bottom",
"showLegend": true
},
"tooltip": {
"mode": "multi",
"sort": "none"
}
},
"pluginVersion": "11.4.0",
"targets": [
{
"datasource": {
"type": "prometheus",
"uid": "${DS_PROMETHEUS}"
},
"exemplar": true,
"expr": "java_lang_ClassLoading_LoadedClassCount{job=\"$job\", instance=\"$app$node\"}",
"format": "time_series",
"interval": "",
"intervalFactor": 1,
"legendFormat": "loaded",
"refId": "A"
},
{
"datasource": {
"type": "prometheus",
"uid": "${DS_PROMETHEUS}"
},
"exemplar": true,
"expr": "java_lang_ClassLoading_UnloadedClassCount{job=\"$job\", instance=\"$app$node\"}",
"format": "time_series",
"interval": "",
"intervalFactor": 1,
"legendFormat": "unloaded",
"refId": "B"
}
],
"title": "Class Loading count",
"type": "timeseries"
},
{
"datasource": {
"type": "prometheus",
"uid": "${DS_PROMETHEUS}"
},
"description": "",
"fieldConfig": {
"defaults": {
"color": {
"mode": "palette-classic"
},
"custom": {
"axisBorderShow": false,
"axisCenteredZero": false,
"axisColorMode": "text",
"axisLabel": "",
"axisPlacement": "auto",
"barAlignment": 0,
"barWidthFactor": 0.6,
"drawStyle": "line",
"fillOpacity": 10,
"gradientMode": "none",
"hideFrom": {
"legend": false,
"tooltip": false,
"viz": false
},
"insertNulls": false,
"lineInterpolation": "linear",
"lineWidth": 1,
"pointSize": 5,
"scaleDistribution": {
"type": "linear"
},
"showPoints": "never",
"spanNulls": true,
"stacking": {
"group": "A",
"mode": "none"
},
"thresholdsStyle": {
"mode": "off"
}
},
"decimals": 0,
"mappings": [],
"thresholds": {
"mode": "absolute",
"steps": [
{
"color": "green"
},
{
"color": "red",
"value": 80
}
]
},
"unit": "short"
},
"overrides": []
},
"gridPos": {
"h": 8,
"w": 12,
"x": 12,
"y": 141
},
"id": 70,
"options": {
"legend": {
"calcs": [
"min",
"lastNotNull",
"max",
"mean"
],
"displayMode": "table",
"placement": "bottom",
"showLegend": true
},
"tooltip": {
"mode": "multi",
"sort": "none"
}
},
"pluginVersion": "11.4.0",
"targets": [
{
"datasource": {
"type": "prometheus",
"uid": "${DS_PROMETHEUS}"
},
"exemplar": true,
"expr": "jvm_classes_currently_loaded {job=\"$job\", instance=\"$app$node\"}",
"format": "time_series",
"interval": "",
"intervalFactor": 5,
"legendFormat": "currently",
"metric": "jvm_classes_loaded",
"refId": "A",
"step": 50
},
{
"datasource": {
"type": "prometheus",
"uid": "${DS_PROMETHEUS}"
},
"exemplar": true,
"expr": "jvm_classes_loaded_total{job=\"$job\", instance=\"$app$node\"}",
"format": "time_series",
"hide": false,
"interval": "",
"intervalFactor": 5,
"legendFormat": "total",
"metric": "jvm_classes_loaded",
"refId": "B",
"step": 50
}
],
"title": "Classes Loaded",
"type": "timeseries"
},
{
"datasource": {
"type": "prometheus",
"uid": "${DS_PROMETHEUS}"
},
"description": "",
"fieldConfig": {
"defaults": {
"color": {
"mode": "palette-classic"
},
"custom": {
"axisBorderShow": false,
"axisCenteredZero": false,
"axisColorMode": "text",
"axisLabel": "",
"axisPlacement": "auto",
"barAlignment": 0,
"barWidthFactor": 0.6,
"drawStyle": "line",
"fillOpacity": 10,
"gradientMode": "none",
"hideFrom": {
"legend": false,
"tooltip": false,
"viz": false
},
"insertNulls": false,
"lineInterpolation": "linear",
"lineWidth": 1,
"pointSize": 5,
"scaleDistribution": {
"type": "linear"
},
"showPoints": "never",
"spanNulls": true,
"stacking": {
"group": "A",
"mode": "none"
},
"thresholdsStyle": {
"mode": "off"
}
},
"mappings": [],
"thresholds": {
"mode": "absolute",
"steps": [
{
"color": "green"
},
{
"color": "red",
"value": 80
}
]
},
"unit": "short"
},
"overrides": []
},
"gridPos": {
"h": 8,
"w": 12,
"x": 0,
"y": 149
},
"id": 117,
"options": {
"legend": {
"calcs": [
"min",
"lastNotNull",
"max",
"mean"
],
"displayMode": "table",
"placement": "bottom",
"showLegend": true
},
"tooltip": {
"mode": "multi",
"sort": "none"
}
},
"pluginVersion": "11.4.0",
"targets": [
{
"datasource": {
"type": "prometheus",
"uid": "${DS_PROMETHEUS}"
},
"exemplar": true,
"expr": "increase(java_lang_ClassLoading_LoadedClassCount{job=\"$job\", instance=\"$app$node\"}[$__interval])",
"format": "time_series",
"interval": "60s",
"intervalFactor": 1,
"legendFormat": "loaded",
"refId": "A"
},
{
"datasource": {
"type": "prometheus",
"uid": "${DS_PROMETHEUS}"
},
"exemplar": true,
"expr": "increase(java_lang_ClassLoading_UnloadedClassCount{job=\"$job\", instance=\"$app$node\"}[$__interval])",
"format": "time_series",
"interval": "60s",
"intervalFactor": 1,
"legendFormat": "unloaded",
"refId": "B"
}
],
"title": "Class Loading count increase",
"type": "timeseries"
},
{
"datasource": {
"type": "prometheus",
"uid": "${DS_PROMETHEUS}"
},
"description": "",
"fieldConfig": {
"defaults": {
"color": {
"mode": "palette-classic"
},
"custom": {
"axisBorderShow": false,
"axisCenteredZero": false,
"axisColorMode": "text",
"axisLabel": "",
"axisPlacement": "auto",
"barAlignment": 0,
"barWidthFactor": 0.6,
"drawStyle": "line",
"fillOpacity": 10,
"gradientMode": "none",
"hideFrom": {
"legend": false,
"tooltip": false,
"viz": false
},
"insertNulls": false,
"lineInterpolation": "linear",
"lineWidth": 1,
"pointSize": 5,
"scaleDistribution": {
"type": "linear"
},
"showPoints": "never",
"spanNulls": true,
"stacking": {
"group": "A",
"mode": "none"
},
"thresholdsStyle": {
"mode": "off"
}
},
"decimals": 0,
"mappings": [],
"thresholds": {
"mode": "absolute",
"steps": [
{
"color": "green"
},
{
"color": "red",
"value": 80
}
]
},
"unit": "short"
},
"overrides": []
},
"gridPos": {
"h": 8,
"w": 12,
"x": 12,
"y": 149
},
"id": 118,
"options": {
"legend": {
"calcs": [
"min",
"lastNotNull",
"max",
"mean"
],
"displayMode": "table",
"placement": "bottom",
"showLegend": true
},
"tooltip": {
"mode": "multi",
"sort": "none"
}
},
"pluginVersion": "11.4.0",
"targets": [
{
"datasource": {
"type": "prometheus",
"uid": "${DS_PROMETHEUS}"
},
"exemplar": true,
"expr": "increase(jvm_classes_currently_loaded {job=\"$job\", instance=\"$app$node\"}[$__interval])",
"format": "time_series",
"interval": "60s",
"intervalFactor": 5,
"legendFormat": "currently",
"metric": "jvm_classes_loaded",
"refId": "A",
"step": 50
},
{
"datasource": {
"type": "prometheus",
"uid": "${DS_PROMETHEUS}"
},
"exemplar": true,
"expr": "increase(jvm_classes_loaded_total{job=\"$job\", instance=\"$app$node\"}[$__interval])",
"format": "time_series",
"hide": false,
"interval": "60s",
"intervalFactor": 5,
"legendFormat": "total",
"metric": "jvm_classes_loaded",
"refId": "B",
"step": 50
}
],
"title": "Classes Loaded increase",
"type": "timeseries"
},
{
"datasource": {
"type": "prometheus",
"uid": "${DS_PROMETHEUS}"
},
"description": "",
"fieldConfig": {
"defaults": {
"color": {
"mode": "palette-classic"
},
"custom": {
"axisBorderShow": false,
"axisCenteredZero": false,
"axisColorMode": "text",
"axisLabel": "",
"axisPlacement": "auto",
"barAlignment": 0,
"barWidthFactor": 0.6,
"drawStyle": "line",
"fillOpacity": 10,
"gradientMode": "none",
"hideFrom": {
"legend": false,
"tooltip": false,
"viz": false
},
"insertNulls": false,
"lineInterpolation": "linear",
"lineWidth": 1,
"pointSize": 5,
"scaleDistribution": {
"type": "linear"
},
"showPoints": "never",
"spanNulls": true,
"stacking": {
"group": "A",
"mode": "none"
},
"thresholdsStyle": {
"mode": "off"
}
},
"mappings": [],
"thresholds": {
"mode": "absolute",
"steps": [
{
"color": "green"
},
{
"color": "red",
"value": 80
}
]
},
"unit": "short"
},
"overrides": []
},
"gridPos": {
"h": 8,
"w": 12,
"x": 0,
"y": 157
},
"id": 169,
"options": {
"legend": {
"calcs": [
"min",
"lastNotNull",
"max",
"mean"
],
"displayMode": "table",
"placement": "bottom",
"showLegend": true
},
"tooltip": {
"mode": "multi",
"sort": "none"
}
},
"pluginVersion": "11.4.0",
"targets": [
{
"datasource": {
"type": "prometheus",
"uid": "${DS_PROMETHEUS}"
},
"exemplar": true,
"expr": "rate(java_lang_ClassLoading_LoadedClassCount{job=\"$job\", instance=\"$app$node\"}[$__rate_interval])",
"format": "time_series",
"interval": "60s",
"intervalFactor": 1,
"legendFormat": "loaded",
"refId": "A"
},
{
"datasource": {
"type": "prometheus",
"uid": "${DS_PROMETHEUS}"
},
"exemplar": true,
"expr": "rate(java_lang_ClassLoading_UnloadedClassCount{job=\"$job\", instance=\"$app$node\"}[$__rate_interval])",
"format": "time_series",
"interval": "60s",
"intervalFactor": 1,
"legendFormat": "unloaded",
"refId": "B"
}
],
"title": "Class Loading count rate",
"type": "timeseries"
},
{
"datasource": {
"type": "prometheus",
"uid": "${DS_PROMETHEUS}"
},
"description": "",
"fieldConfig": {
"defaults": {
"color": {
"mode": "palette-classic"
},
"custom": {
"axisBorderShow": false,
"axisCenteredZero": false,
"axisColorMode": "text",
"axisLabel": "",
"axisPlacement": "auto",
"barAlignment": 0,
"barWidthFactor": 0.6,
"drawStyle": "line",
"fillOpacity": 10,
"gradientMode": "none",
"hideFrom": {
"legend": false,
"tooltip": false,
"viz": false
},
"insertNulls": false,
"lineInterpolation": "linear",
"lineWidth": 1,
"pointSize": 5,
"scaleDistribution": {
"type": "linear"
},
"showPoints": "never",
"spanNulls": true,
"stacking": {
"group": "A",
"mode": "none"
},
"thresholdsStyle": {
"mode": "off"
}
},
"decimals": 0,
"mappings": [],
"thresholds": {
"mode": "absolute",
"steps": [
{
"color": "green"
},
{
"color": "red",
"value": 80
}
]
},
"unit": "short"
},
"overrides": []
},
"gridPos": {
"h": 8,
"w": 12,
"x": 12,
"y": 157
},
"id": 170,
"options": {
"legend": {
"calcs": [
"min",
"lastNotNull",
"max",
"mean"
],
"displayMode": "table",
"placement": "bottom",
"showLegend": true
},
"tooltip": {
"mode": "multi",
"sort": "none"
}
},
"pluginVersion": "11.4.0",
"targets": [
{
"datasource": {
"type": "prometheus",
"uid": "${DS_PROMETHEUS}"
},
"exemplar": true,
"expr": "rate(jvm_classes_currently_loaded {job=\"$job\", instance=\"$app$node\"}[$__rate_interval])",
"format": "time_series",
"interval": "60s",
"intervalFactor": 5,
"legendFormat": "currently",
"metric": "jvm_classes_loaded",
"refId": "A",
"step": 50
},
{
"datasource": {
"type": "prometheus",
"uid": "${DS_PROMETHEUS}"
},
"exemplar": true,
"expr": "rate(jvm_classes_loaded_total{job=\"$job\", instance=\"$app$node\"}[$__rate_interval])",
"format": "time_series",
"hide": false,
"interval": "60s",
"intervalFactor": 5,
"legendFormat": "total",
"metric": "jvm_classes_loaded",
"refId": "B",
"step": 50
}
],
"title": "Classes Loaded rate",
"type": "timeseries"
}
],
"refresh": "auto",
"schemaVersion": 40,
"tags": [
"jmx",
"JVM",
"prometheus"
],
"templating": {
"list": [
{
"current": {},
"datasource": {
"type": "prometheus",
"uid": "${DS_PROMETHEUS}"
},
"definition": "label_values(jvm_info, job)",
"includeAll": false,
"label": "job",
"name": "job",
"options": [],
"query": {
"query": "label_values(jvm_info, job)",
"refId": "StandardVariableQuery"
},
"refresh": 1,
"regex": "",
"type": "query"
},
{
"current": {},
"datasource": {
"type": "prometheus",
"uid": "${DS_PROMETHEUS}"
},
"definition": "label_values(up{job=\"$job\"}, instance)",
"includeAll": false,
"label": "app",
"name": "app",
"options": [],
"query": {
"query": "label_values(up{job=\"$job\"}, instance)",
"refId": "StandardVariableQuery"
},
"refresh": 1,
"regex": "/^([^\\[]+)/",
"type": "query"
},
{
"current": {},
"datasource": {
"type": "prometheus",
"uid": "${DS_PROMETHEUS}"
},
"definition": "label_values(up{job=\"$job\"}, instance)",
"includeAll": false,
"label": "node",
"name": "node",
"options": [],
"query": {
"query": "label_values(up{job=\"$job\"}, instance)",
"refId": "StandardVariableQuery"
},
"refresh": 1,
"regex": "/$app(\\[[^\\]]+\\])$/",
"type": "query"
},
{
"current": {},
"datasource": {
"type": "prometheus",
"uid": "${DS_PROMETHEUS}"
},
"definition": "label_values(jvm_memory_used_bytes{job=\"$job\", instance=\"$app$node\"},area)",
"hide": 2,
"includeAll": true,
"multi": true,
"name": "memarea",
"options": [],
"query": {
"qryType": 1,
"query": "label_values(jvm_memory_used_bytes{job=\"$job\", instance=\"$app$node\"},area)",
"refId": "PrometheusVariableQueryEditor-VariableQuery"
},
"refresh": 2,
"regex": "",
"type": "query"
},
{
"current": {},
"datasource": {
"type": "prometheus",
"uid": "${DS_PROMETHEUS}"
},
"definition": "label_values(jvm_memory_pool_max_bytes{job=\"$job\", instance=\"$app$node\"},pool)",
"hide": 2,
"includeAll": true,
"multi": true,
"name": "mempool",
"options": [],
"query": {
"qryType": 1,
"query": "label_values(jvm_memory_pool_max_bytes{job=\"$job\", instance=\"$app$node\"},pool)",
"refId": "PrometheusVariableQueryEditor-VariableQuery"
},
"refresh": 1,
"regex": "",
"type": "query"
}
]
},
"time": {
"from": "now-1h",
"to": "now"
},
"timepicker": {
"nowDelay": "",
"refresh_intervals": [
"1m",
"5m",
"15m",
"30m",
"1h",
"2h",
"1d"
]
},
"timezone": "",
"title": "JMX Dashboard(Basic)",
"uid": "9IFafKA4z",
"version": 3,
"weekStart": ""
}{
"__inputs": [
{
"description": "",
"label": "Prometheus",
"name": "DS_PROMETHEUS",
"pluginId": "prometheus",
"pluginName": "Prometheus",
"type": "datasource"
}
],
"__requires": [
{
"id": "grafana",
"name": "Grafana",
"type": "grafana",
"version": "5.0.0"
},
{
"id": "graph",
"name": "Graph",
"type": "panel",
"version": ""
},
{
"id": "prometheus",
"name": "Prometheus",
"type": "datasource",
"version": "1.0.0"
},
{
"id": "singlestat",
"name": "Singlestat",
"type": "panel",
"version": ""
}
],
"annotations": {
"list": [
{
"builtIn": 1,
"datasource": "-- Grafana --",
"enable": true,
"hide": true,
"iconColor": "rgba(0, 211, 255, 1)",
"name": "Annotations & Alerts",
"type": "dashboard"
}
]
},
"description": "Official dashboard for NGINX Prometheus exporter",
"editable": true,
"gnetId": null,
"graphTooltip": 0,
"id": null,
"iteration": 1562682051068,
"links": [],
"panels": [
{
"collapsed": false,
"datasource": "${DS_PROMETHEUS}",
"gridPos": {
"h": 1,
"w": 24,
"x": 0,
"y": 0
},
"id": 4,
"panels": [],
"title": "Status",
"type": "row"
},
{
"cacheTimeout": null,
"colorBackground": true,
"colorPostfix": false,
"colorPrefix": false,
"colorValue": false,
"colors": [
"#E02F44",
"#FF9830",
"#299c46"
],
"datasource": "${DS_PROMETHEUS}",
"decimals": null,
"description": "",
"format": "none",
"gauge": {
"maxValue": 100,
"minValue": 0,
"show": false,
"thresholdLabels": false,
"thresholdMarkers": true
},
"gridPos": {
"h": 3,
"w": 12,
"x": 0,
"y": 1
},
"id": 8,
"interval": null,
"links": [],
"mappingType": 1,
"mappingTypes": [
{
"name": "value to text",
"value": 1
},
{
"name": "range to text",
"value": 2
}
],
"maxDataPoints": 100,
"nullPointMode": "connected",
"nullText": null,
"options": {},
"postfix": "",
"postfixFontSize": "50%",
"prefix": "",
"prefixFontSize": "50%",
"rangeMaps": [
{
"from": "null",
"text": "N/A",
"to": "null"
}
],
"repeat": "instance",
"repeatDirection": "h",
"sparkline": {
"fillColor": "rgba(31, 118, 189, 0.18)",
"full": false,
"lineColor": "rgb(31, 120, 193)",
"show": false
},
"tableColumn": "",
"targets": [
{
"expr": "nginx_up{instance=~\"$instance\"}",
"format": "time_series",
"instant": false,
"intervalFactor": 1,
"refId": "A"
}
],
"thresholds": "1,1",
"timeFrom": null,
"timeShift": null,
"title": "NGINX Status for $instance",
"type": "singlestat",
"valueFontSize": "100%",
"valueMaps": [
{
"op": "=",
"text": "Down",
"value": "0"
},
{
"op": "=",
"text": "Up",
"value": "1"
}
],
"valueName": "current"
},
{
"collapsed": false,
"datasource": "${DS_PROMETHEUS}",
"gridPos": {
"h": 1,
"w": 24,
"x": 0,
"y": 4
},
"id": 6,
"panels": [],
"title": "Metrics",
"type": "row"
},
{
"aliasColors": {},
"bars": false,
"dashLength": 10,
"dashes": false,
"datasource": "${DS_PROMETHEUS}",
"decimals": null,
"description": "",
"fill": 1,
"gridPos": {
"h": 10,
"w": 12,
"x": 0,
"y": 5
},
"id": 10,
"legend": {
"alignAsTable": false,
"avg": false,
"current": false,
"hideEmpty": false,
"max": false,
"min": false,
"rightSide": false,
"show": true,
"total": false,
"values": false
},
"lines": true,
"linewidth": 1,
"links": [],
"nullPointMode": "null",
"options": {},
"percentage": false,
"pointradius": 2,
"points": false,
"renderer": "flot",
"seriesOverrides": [],
"spaceLength": 10,
"stack": false,
"steppedLine": false,
"targets": [
{
"expr": "irate(nginx_connections_accepted{instance=~\"$instance\"}[5m])",
"format": "time_series",
"instant": false,
"intervalFactor": 1,
"legendFormat": "{{instance}} accepted",
"refId": "A"
},
{
"expr": "irate(nginx_connections_handled{instance=~\"$instance\"}[5m])",
"format": "time_series",
"instant": false,
"intervalFactor": 1,
"legendFormat": "{{instance}} handled",
"refId": "B"
}
],
"thresholds": [],
"timeFrom": null,
"timeRegions": [],
"timeShift": null,
"title": "Processed connections",
"tooltip": {
"shared": true,
"sort": 0,
"value_type": "individual"
},
"type": "graph",
"xaxis": {
"buckets": null,
"mode": "time",
"name": null,
"show": true,
"values": []
},
"yaxes": [
{
"decimals": 1,
"format": "short",
"label": "Connections (rate)",
"logBase": 1,
"max": null,
"min": null,
"show": true
},
{
"format": "short",
"label": "",
"logBase": 1,
"max": null,
"min": null,
"show": true
}
],
"yaxis": {
"align": false,
"alignLevel": null
}
},
{
"aliasColors": {},
"bars": false,
"dashLength": 10,
"dashes": false,
"datasource": "${DS_PROMETHEUS}",
"decimals": 0,
"fill": 1,
"gridPos": {
"h": 10,
"w": 12,
"x": 12,
"y": 5
},
"id": 12,
"legend": {
"alignAsTable": false,
"avg": false,
"current": false,
"max": false,
"min": false,
"rightSide": false,
"show": true,
"total": false,
"values": false
},
"lines": true,
"linewidth": 1,
"links": [],
"nullPointMode": "null",
"options": {},
"percentage": false,
"pointradius": 2,
"points": false,
"renderer": "flot",
"seriesOverrides": [],
"spaceLength": 10,
"stack": false,
"steppedLine": false,
"targets": [
{
"expr": "nginx_connections_active{instance=~\"$instance\"}",
"format": "time_series",
"intervalFactor": 1,
"legendFormat": "{{instance}} active",
"refId": "A"
},
{
"expr": "nginx_connections_reading{instance=~\"$instance\"}",
"format": "time_series",
"intervalFactor": 1,
"legendFormat": "{{instance}} reading",
"refId": "B"
},
{
"expr": "nginx_connections_waiting{instance=~\"$instance\"}",
"format": "time_series",
"intervalFactor": 1,
"legendFormat": "{{instance}} waiting",
"refId": "C"
},
{
"expr": "nginx_connections_writing{instance=~\"$instance\"}",
"format": "time_series",
"intervalFactor": 1,
"legendFormat": "{{instance}} writing",
"refId": "D"
}
],
"thresholds": [],
"timeFrom": null,
"timeRegions": [],
"timeShift": null,
"title": "Active Connections",
"tooltip": {
"shared": true,
"sort": 0,
"value_type": "individual"
},
"type": "graph",
"xaxis": {
"buckets": null,
"mode": "time",
"name": null,
"show": true,
"values": []
},
"yaxes": [
{
"decimals": 0,
"format": "short",
"label": "Connections",
"logBase": 1,
"max": null,
"min": null,
"show": true
},
{
"format": "short",
"label": null,
"logBase": 1,
"max": null,
"min": null,
"show": true
}
],
"yaxis": {
"align": false,
"alignLevel": null
}
},
{
"aliasColors": {},
"bars": false,
"dashLength": 10,
"dashes": false,
"datasource": "${DS_PROMETHEUS}",
"fill": 1,
"gridPos": {
"h": 8,
"w": 24,
"x": 0,
"y": 15
},
"id": 15,
"legend": {
"avg": false,
"current": false,
"max": false,
"min": false,
"show": true,
"total": false,
"values": false
},
"lines": true,
"linewidth": 1,
"links": [],
"nullPointMode": "null",
"options": {},
"percentage": false,
"pointradius": 2,
"points": false,
"renderer": "flot",
"seriesOverrides": [],
"spaceLength": 10,
"stack": false,
"steppedLine": false,
"targets": [
{
"expr": "irate(nginx_http_requests_total{instance=~\"$instance\"}[5m])",
"format": "time_series",
"intervalFactor": 1,
"legendFormat": "{{instance}} total requests",
"refId": "A"
}
],
"thresholds": [],
"timeFrom": null,
"timeRegions": [],
"timeShift": null,
"title": "Total requests",
"tooltip": {
"shared": true,
"sort": 0,
"value_type": "individual"
},
"type": "graph",
"xaxis": {
"buckets": null,
"mode": "time",
"name": null,
"show": true,
"values": []
},
"yaxes": [
{
"format": "short",
"label": null,
"logBase": 1,
"max": null,
"min": null,
"show": true
},
{
"format": "short",
"label": null,
"logBase": 1,
"max": null,
"min": null,
"show": true
}
],
"yaxis": {
"align": false,
"alignLevel": null
}
}
],
"refresh": "5s",
"schemaVersion": 18,
"style": "dark",
"tags": [
"nginx",
"prometheus",
"nginx prometheus exporter"
],
"templating": {
"list": [
{
"current": {
"selected": false,
"tags": [],
"text": "default",
"value": "default"
},
"hide": 0,
"includeAll": false,
"label": "datasource",
"multi": false,
"name": "DS_PROMETHEUS",
"options": [],
"query": "prometheus",
"refresh": 1,
"regex": "",
"skipUrlSync": false,
"type": "datasource"
},
{
"allValue": null,
"current": {},
"datasource": "${DS_PROMETHEUS}",
"definition": "label_values(nginx_up, instance)",
"hide": 0,
"includeAll": true,
"label": "",
"multi": true,
"name": "instance",
"options": [],
"query": "label_values(nginx_up, instance)",
"refresh": 1,
"regex": "",
"skipUrlSync": false,
"sort": 0,
"tagValuesQuery": "",
"tags": [],
"tagsQuery": "",
"type": "query",
"useTags": false
}
]
},
"time": {
"from": "now-15m",
"to": "now"
},
"timepicker": {
"refresh_intervals": [
"5s",
"10s",
"30s",
"1m",
"5m",
"15m",
"30m",
"1h",
"2h",
"1d"
],
"time_options": [
"5m",
"15m",
"1h",
"6h",
"12h",
"24h",
"2d",
"7d",
"30d"
]
},
"timezone": "",
"title": "NGINX",
"uid": "MsjffzSZz",
"version": 1
}